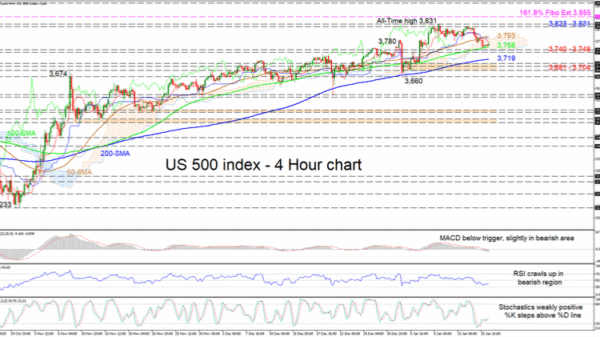
The US 500 index (Cash) is finding a foothold in the Ichimoku cloud, on the 100-period simple moving average (SMA) at 3,756, after the index receded from its latest all-time high of 3,831 under the 50-period SMA. All climbing SMAs are endorsing the positive picture, while the Ichimoku lines, with the dipping red Tenkan-sen line, are promoting the pullback in price.
The short-term oscillators are proposing a tad increase in positive momentum. The MACD is flattening below its red signal line in the negative region, while the RSI is creeping up in the bearish territory. Furthermore, the stochastic oscillator has turned faintly positive with the %K line improving above its % D line.
If strong traction materialises off the 100-period SMA at 3,756, early resistance may occur at the cloud’s upper surface around the 50-period SMA at 3,793. However, if buyers overtake this obstacle, the price may run-up towards the resistance section of 3,823-3,831, which includes the fresh all-time high. Should the bulls conquer the top of 3,831 too, they may target the 3,855 level, which happens to be the 161.8% Fibonacci extension of the down leg from 3,780 until 3,660.
Conversely, if the bears take the upper hand and steer the price below the 100-period SMA, immediate hardened support could be encountered from the region of 3,740-3,748. A successful dive underneath the floor of the cloud may see the retracement challenge the 200-period SMA at 3,719. Should the price plummet further, the zone of lows of 3,681-3,704 could try to dismiss the decline ahead of the 3,660 trough.
Summarizing, a deeper retraction would need to take place in order to trigger worries in the positive bias of the US 500 index, which is safeguarded above the 200-period SMA and the 3,660 trough.
 Signal2forex.com - Best Forex robots and signals


