
📑 Table of Contents
1. What Is the VIX Index?
The CBOE Volatility Index (VIX) is a real‑time measure of expected volatility in the S&P 500 over the next 30 days. Often called the “fear gauge” of Wall Street, the VIX rises when investors expect significant market turbulence and falls during periods of calm. It is derived from the prices of S&P 500 index options (SPX) and reflects the market’s collective expectation of future price swings.
First introduced in 1993, the VIX has become a cornerstone of modern financial analysis. It is used by traders, portfolio managers, and policymakers to gauge market sentiment, hedge portfolios, and time market entries. The VIX does not predict the direction of market moves — only the expected magnitude of price changes.
2. How Does the VIX Work?
The VIX works by analysing the bid‑ask midpoints of a wide range of SPX call and put options across many strike prices. It calculates implied volatility — what the options market expects for future price movement — using a complex formula that aggregates options with different expiration dates and strike prices.
Calculation Methodology
The VIX uses the prices of out‑of‑the‑money SPX options to create a weighted average of implied volatility. The formula blends options with 23 to 37 days to expiration, then interpolates to a constant 30‑day maturity. This approach ensures the VIX reflects only market‑driven volatility, unaffected by individual option quirks.
Understanding Implied Volatility
Unlike historical volatility (which looks at past price movements), implied volatility is forward‑looking. It represents the market’s consensus of how much the S&P 500 might move over the next month. When the VIX is high, options are expensive, indicating fear; when low, options are cheap, signalling complacency.
What Do VIX Levels Mean?
The VIX typically averages between 15 and 20 in normal market conditions. Levels below 15 suggest complacency, while readings above 25 indicate elevated fear. Spikes above 35‑40 are often associated with market crises or panic selling. In 2026, the VIX ranged from 14.43 to 35.30, reflecting ongoing economic uncertainty.
3. VIX and S&P 500 Relationship
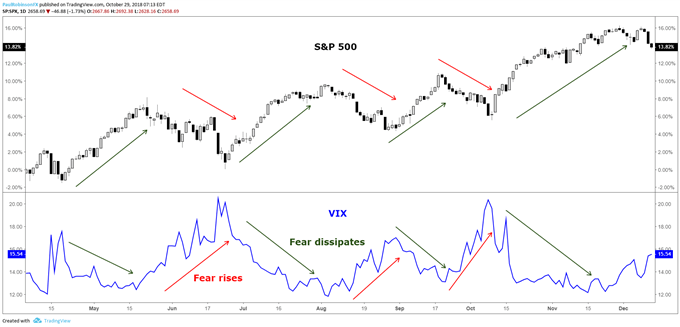
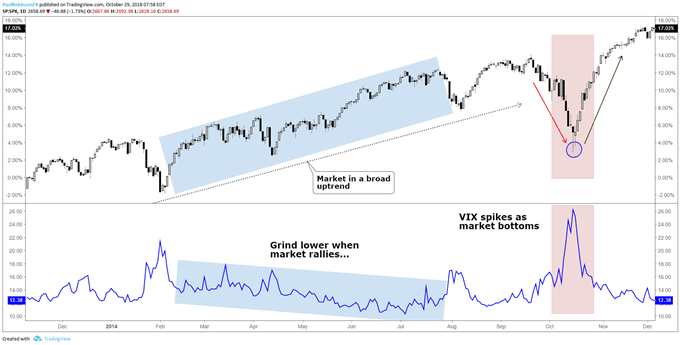
The VIX and the S&P 500 share a strong inverse correlation. When stocks fall, the VIX typically rises as investors buy put options for protection. Conversely, when stocks rise, the VIX tends to decline as demand for protection wanes. This relationship is not perfect and can break down during certain market conditions.
Why the Inverse Correlation Exists
The inverse correlation stems from investor behaviour: during market declines, fear increases, driving up demand for put options, which raises their prices and, consequently, the VIX. The opposite occurs during bull markets. The correlation is strongest during sharp market moves and tends to weaken during prolonged periods of low volatility.
Historical Correlation Data
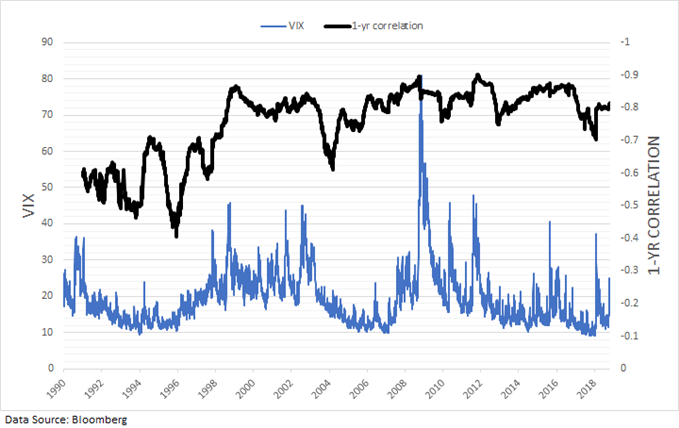
Since the VIX’s inception in 1990, the correlation between the VIX and the S&P 500 has averaged approximately −77%. Over the last decade, this figure has strengthened to around −81%, driven by increased options trading and the rise of VIX‑linked products. The rolling 1‑year correlation has ranged from −70% to −90%.
When the Correlation Breaks Down
The VIX‑S&P 500 correlation can weaken during periods of extreme market stress, when both may fall simultaneously as investors de‑risk, or when the VIX remains elevated even as stocks recover, reflecting lingering uncertainty. These dislocations can create opportunities for sophisticated traders.
4. How to Read the VIX: Fear Gauge Levels
Understanding VIX levels is essential for interpreting market sentiment and making informed trading decisions. The table below maps VIX readings to market conditions and trading implications.
| VIX Level | Market Sentiment | What It Means | Trading Implication |
|---|---|---|---|
| 0–12 | Extreme Complacency | Investors are very confident; little demand for protection | Caution: potential market top |
| 12–15 | Low Fear | Normal bullish market conditions | Continue with trend‑following strategies |
| 15–20 | Moderate Fear | Typical market environment | Normal trading conditions |
| 20–25 | Elevated Fear | Increased uncertainty; investors buying protection | Reduce position size; tighten stops |
| 25–30 | High Fear | Significant market stress | Look for potential buying opportunities |
| 30–35 | Extreme Fear | Panic selling; VIX spikes | Contrarian buy signal; market may be bottoming |
| 35+ | Severe Panic | Crisis‑level volatility | Aggressive buying opportunity for long‑term investors |
📌 These levels are general guidelines and may vary based on the broader market context. Always combine VIX readings with other indicators for confirmation.
5. VIX Trading Strategies
While you cannot trade the VIX directly, a variety of products allow you to profit from volatility movements. Below are the most effective strategies for incorporating the VIX into your trading.
Contrarian Strategy (Buy When Fear Is High)
This strategy involves buying when the VIX spikes above 30‑35, as extreme fear often coincides with market bottoms. Conversely, selling or reducing exposure when the VIX falls below 12‑15 can help avoid overextended bull markets. This approach aligns with Warren Buffett’s famous advice: “Be fearful when others are greedy, and greedy when others are fearful.”
Risk Management with VIX
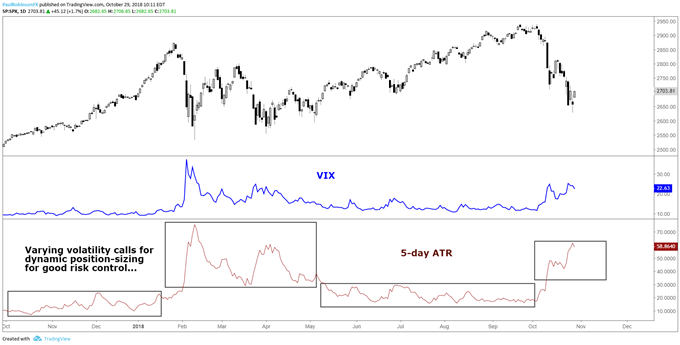
The VIX is a powerful tool for dynamic position sizing. When the VIX is high, reduce position sizes to account for increased volatility; when the VIX is low, you can increase exposure. Additionally, monitor VIX term structure (contango vs. backwardation) to gauge whether volatility is expected to rise or fall.
VIX as a Market Timing Tool
Many traders use VIX spikes as entry signals for buying the S&P 500, as volatility surges often precede strong rallies. However, timing is critical — entering too early can lead to further losses. Combining VIX readings with moving averages or RSI can improve timing accuracy.
VIX Products: Futures, Options & ETFs
Several products offer exposure to the VIX: VIX futures (traded on Cboe), VIX options, and exchange‑traded products like VXX (iPath Series B S&P 500 VIX Short‑Term Futures ETN), UVXY (ProShares Ultra VIX Short‑Term Futures ETF), and SVXY (ProShares Short VIX Short‑Term Futures ETF). Each has unique characteristics, risk profiles, and decay patterns that require careful study before trading.
6. VIX vs Other Volatility Indicators
While the VIX is the most widely followed volatility index, it is not the only measure available. The table below compares the VIX with other common volatility indicators.
| Indicator | Type | Calculation | Best Use |
|---|---|---|---|
| VIX | Forward‑looking (implied) | SPX options prices | Market sentiment, fear gauge |
| VIX Futures | Forward‑looking | Based on VIX index | Hedging, speculation |
| VXX (ETN) | Track VIX futures | VIX short‑term futures | Retail VIX exposure |
| UVXY (ETF) | Leveraged VIX | 1.5x VIX short‑term futures | Short‑term volatility trading |
| SVXY (ETF) | Inverse VIX | −0.5x VIX short‑term futures | Short volatility strategy |
| ATR | Historical | Past price ranges | Position sizing, stop‑loss placement |
📌 Each indicator serves a different purpose. The VIX is best for gauging market fear, while ATR is more useful for setting stop‑losses and position sizes.
7. Frequently Asked Questions
What is the VIX index?
The VIX (CBOE Volatility Index) is a real‑time measure of expected volatility in the S&P 500 over the next 30 days. It is calculated from S&P 500 index options prices and is often called the “fear gauge” of the stock market.
How does the VIX work?
The VIX works by analysing the prices of a wide range of S&P 500 put and call options. It uses the bid‑ask midpoints across many strike prices to calculate implied volatility — what the options market expects for future price movement.
What is the relationship between VIX and S&P 500?
The VIX and S&P 500 have a strong inverse relationship. When the S&P 500 falls, the VIX typically rises as investors buy put options for protection. The historical correlation is approximately −77% to −81%.
What does a high VIX mean?
A high VIX (above 25‑30) indicates elevated fear and uncertainty in the market. It typically occurs during market sell‑offs and can signal that selling may be overdone, potentially presenting a contrarian buying opportunity.
What does a low VIX mean?
A low VIX (below 15‑20) suggests market complacency and investor confidence. While it indicates stability, it can also warn that the market may be overextended and vulnerable to a correction.
Can you trade the VIX directly?
No, you cannot trade the VIX index directly. However, you can trade VIX futures, VIX options, and exchange‑traded products (ETPs) like VXX, UVXY, and SVXY that track VIX derivatives.
How is the VIX calculated?
The VIX is calculated in real time using the prices of S&P 500 index options (SPX). Cboe uses the bid‑ask midpoints of a wide range of SPX call and put options across many strike prices to derive the expected volatility.
What is the VIX fear gauge?
The “fear gauge” is a nickname for the VIX because it typically rises when investors are fearful (during market declines) and falls when investors are complacent (during bull markets).
How can I use the VIX for trading?
Traders use the VIX to gauge market sentiment, time entries and exits, and adjust position sizing. A common strategy is to buy when the VIX spikes (fear is high) and be cautious when the VIX is very low (complacency).
What is the VIX‑S&P 500 correlation in 2026?
The inverse correlation remains strong at approximately −77% to −81%. In 2026, the VIX has ranged from 14.43 to 35.30, with levels above 20 during periods of market uncertainty.
📖 Need Assistance? Visit our comprehensive Help Centre for detailed guides on trading platforms, account setup, and advanced strategies to enhance your trading experience.
🤖 Automate Your Trading: Browse our curated collection of forex trading robots and Expert Advisors — fully automated systems designed to execute strategies with precision, backtesting, and consistent performance.



 Signal2forex.com - Best Forex robots and signals


