
📑 Table of Contents
1. What Is the ATR Indicator (Average True Range)?
The Average True Range (ATR) is a technical analysis indicator developed by J. Welles Wilder in 1978. It measures market volatility by calculating the average price range over a specified period. Unlike many other indicators, the ATR does not predict price direction — it only measures the magnitude of price movement, making it an essential tool for risk management, position sizing, and stop-loss placement.
Wilder introduced the ATR in his book “New Concepts in Technical Trading Systems” alongside other classic indicators like the Relative Strength Index (RSI) and the Average Directional Index (ADX). The ATR has since become one of the most widely used volatility indicators in trading across all asset classes — forex, stocks, commodities, and cryptocurrencies.
2. How Is ATR Calculated?
Understanding how the ATR is calculated helps traders appreciate what the indicator actually measures and how to interpret its readings correctly.
Understanding True Range
The ATR is based on the True Range (TR), which Wilder defined as the greatest of the following three values:
- High – Low — the current period’s price range
- High – Previous Close — the gap up from the previous close
- Previous Close – Low — the gap down from the previous close
The True Range accounts for price gaps that would otherwise be ignored by a simple high-low range calculation.
The ATR Formula
The ATR is calculated as the exponential moving average of the True Range over a specified number of periods. Wilder’s original formula used a 14-period average, which remains the industry standard:
ATR = Average of True Range over n periods
Wilder used a smoothing technique that is essentially an exponential moving average, but many platforms now allow users to choose between SMA and EMA methods.
Step-by-Step Calculation Example
To calculate a 14-period ATR:
- Calculate the True Range (TR) for each of the last 14 periods
- Calculate the average of these 14 TR values (this is the initial ATR)
- For subsequent periods, apply Wilder’s smoothing formula: ATR = [(Previous ATR × 13) + Current TR] / 14
The ATR value changes each period, reflecting the current level of volatility.
3. How to Read the ATR Indicator
Reading the ATR is straightforward but requires context. The indicator provides a single number that represents the average price movement over the selected period.
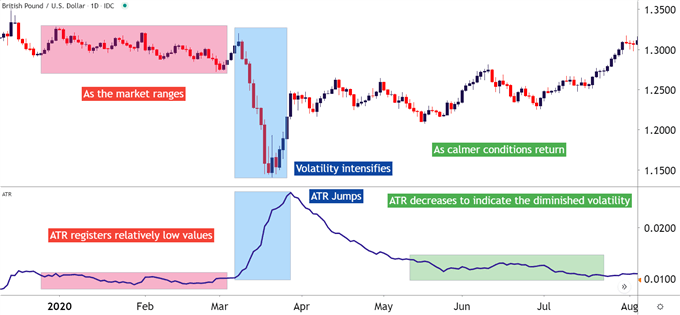
What High ATR Means
A high ATR indicates that the asset is experiencing high volatility — wide price swings are occurring. This often happens during:
- Major news events or economic releases
- Market uncertainty or crisis periods
- Strong trending markets with large daily ranges
When ATR is high, traders should expect larger price movements and adjust their position sizes and stop-losses accordingly.
What Low ATR Means
A low ATR indicates that the asset is experiencing low volatility — narrow price swings are occurring. This often happens during:
- Consolidation or range-bound markets
- Low market participation (holidays, low liquidity)
- Periods of market complacency
When ATR is low, traders can use tighter stops and smaller profit targets.
ATR Trends and Volatility Regimes
Tracking the ATR over time reveals volatility regimes. A rising ATR suggests increasing volatility, while a falling ATR suggests decreasing volatility. This information can help traders anticipate market conditions and adjust their strategies.
4. ATR Trading Strategies
The ATR is one of the most versatile indicators for risk management and trade execution. Here are the most effective ways to use it in your trading.
Stop-Loss Placement with ATR
Using ATR for stop-loss placement is one of the most common applications. The principle is simple: place your stop at a distance of ATR × multiplier from your entry price. This ensures your stop is:
- Wide enough to withstand normal market noise
- Adaptive to current market volatility
- Objective and free from emotional bias
For example, in a long trade with a 1.5× ATR multiplier, place your stop at: Entry Price − (ATR × 1.5)
Position Sizing with ATR
ATR-based position sizing helps traders adjust their trade size based on volatility. The formula is:
Position Size = Risk Amount ÷ (ATR × Multiplier)
For example, if you’re willing to risk $100 and the ATR is $2 with a 1.5× multiplier: 100 ÷ (2 × 1.5) = 33.3 units
This approach keeps your risk consistent across different markets and volatility conditions.
Trailing Stop Strategy
ATR can also be used to create dynamic trailing stops. As price moves in your favour, adjust your stop to a fixed ATR distance below (for longs) or above (for shorts) the current price:
- Long Trade: Trail stop at Current Price − (ATR × 2.0)
- Short Trade: Trail stop at Current Price + (ATR × 2.0)
This allows your stop to “breathe” with market volatility while protecting profits.
Profit Target Setting with ATR
Set profit targets using ATR-based multiples to align with current volatility. Common approaches include:
- Conservative: Entry + (ATR × 1.5) for longs
- Moderate: Entry + (ATR × 2.5) for longs
- Aggressive: Entry + (ATR × 4.0) for longs
Breakout Confirmation with ATR
Use the ATR to confirm the strength of a breakout. A breakout is considered more reliable when the price moves at least 1.5× to 2× the ATR beyond the breakout level. This suggests real momentum rather than a false breakout.
5. Best ATR Settings by Trading Style
The optimal ATR settings depend on your trading style and timeframe. The table below provides recommended configurations for different approaches.
| Trading Style | ATR Period | Best Timeframe | Multiplier for Stops | Typical Use |
|---|---|---|---|---|
| Scalping | 7–9 | 1–5 minutes | 0.5–1.0× | Tight stops, quick targets |
| Day Trading | 9–14 | 5–15 minutes | 1.0–1.5× | Intraday volatility management |
| Swing Trading | 14 | 1–4 hours | 1.5–2.0× | Medium-term trend following |
| Position Trading | 21–30 | Daily | 2.0–3.0× | Long-term volatility assessment |
📌 These are starting points. Adjust based on your specific trading style and the asset’s typical behaviour.
6. ATR vs Other Volatility Indicators
While the ATR is one of the most popular volatility indicators, it is not the only one available. The table below compares the ATR with other common volatility measures.
| Feature | ATR | Standard Deviation | Bollinger Bands | VIX |
|---|---|---|---|---|
| Type | Volatility (historical) | Volatility (historical) | Volatility + Price | Volatility (implied) |
| Direction | No | No | Yes (with price) | No |
| Calculation | True Range average | Price variance | Standard deviation | Options prices |
| Best For | Stop-loss, position sizing | Statistical analysis | Breakout identification | Market fear gauge |
| Lag | Yes | Yes | Yes | Yes (implied) |
📌 Each indicator serves a different purpose. The ATR is best for practical risk management, while the VIX is better for gauging market sentiment.
7. Common Mistakes to Avoid
Even experienced traders make mistakes when using the ATR. Here are the most common pitfalls and how to avoid them.
- Using the Wrong Period: The default 14-period setting works well for daily charts but may need adjustment for shorter timeframes. Scalpers often use 7–9 periods, while position traders may prefer 21–30 periods.
- Ignoring the Asset: ATR is not directly comparable across assets. A 10-point ATR in a low-priced stock is completely different from a 10-point ATR in a high-priced forex pair. Always interpret ATR in the context of the asset’s price level.
- Using a Fixed Multiplier in All Conditions: ATR multipliers should be adjusted based on market conditions. In high volatility, use wider multipliers; in low volatility, use tighter ones.
- Forgetting That ATR Is a Lagging Indicator: ATR measures past volatility — it does not predict future volatility. Use it as a guide, not a crystal ball.
- Using ATR in Isolation: No single indicator should be used in isolation. Combine ATR with other tools like support/resistance, RSI, or moving averages for better results.
- Ignoring Multi-Timeframe Analysis: Check ATR on multiple timeframes to get a complete picture of volatility. A low ATR on a 1-minute chart might still be high on a 15-minute chart.
8. Frequently Asked Questions
What is the ATR indicator?
The ATR (Average True Range) is a technical indicator developed by J. Welles Wilder that measures market volatility by calculating the average price range over a specified period. It does not predict price direction — only the magnitude of price movement.
How is ATR calculated?
ATR is calculated by first finding the True Range (TR) — the greatest of (high – low), (high – previous close), or (previous close – low). Then, the ATR is the exponential moving average of the TR over a specified period, typically 14.
What does a high ATR mean?
A high ATR indicates high volatility, meaning the asset is experiencing wide price swings. This often occurs during periods of market uncertainty, major news events, or strong trends.
What does a low ATR mean?
A low ATR indicates low volatility, meaning the asset is experiencing narrow price swings. This often occurs during consolidation periods or low market participation.
How do you use ATR for stop-loss placement?
Place your stop-loss at entry price ± (ATR × multiplier). For example, in a long trade with a 1.5× ATR multiplier, set your stop at entry price minus (ATR × 1.5). The multiplier adjusts based on market conditions.
What is the best ATR setting for day trading?
For day trading, an ATR period of 9–14 with a 1.0–1.5× multiplier is commonly used. The best timeframe is 5–15 minutes for intraday volatility assessment.
How do you use ATR for position sizing?
Position size = Risk amount ÷ (ATR × multiplier). For example, if you’re willing to risk $100 and the ATR is $2 with a 1.5× multiplier, your position size would be 100 ÷ (2 × 1.5) = 33.3 units.
Is ATR a leading or lagging indicator?
ATR is a lagging indicator because it calculates volatility based on past price movements. It helps you prepare for future volatility but does not predict it.
Can ATR be used in all markets?
Yes, ATR can be applied to any market — stocks, forex, commodities, and cryptocurrencies. It is particularly useful for setting dynamic stops and position sizing in volatile markets.
What is the difference between ATR and standard deviation?
ATR measures volatility using price ranges (high – low) and gaps, while standard deviation measures volatility based on price variance from the mean. ATR is more intuitive for stop-loss placement, while standard deviation is better for statistical analysis.
Apa itu indikator ATR?
Indikator ATR (Average True Range) adalah indikator teknis yang dikembangkan oleh J. Welles Wilder yang mengukur volatilitas pasar dengan menghitung rata-rata rentang harga selama periode tertentu. Indikator ini tidak memprediksi arah harga — hanya besarnya pergerakan harga.
Bagaimana cara menghitung ATR?
ATR dihitung dengan mencari True Range (TR) terlebih dahulu — nilai terbesar dari (tertinggi – terendah), (tertinggi – penutupan sebelumnya), atau (penutupan sebelumnya – terendah). Kemudian, ATR adalah rata-rata bergerak eksponensial dari TR selama periode tertentu, biasanya 14.
📈 Combine Volatility with Reversal Patterns: Enhance your trading strategy by combining ATR-based risk management with our comprehensive guide to trading the inverted hammer candlestick pattern — a powerful bullish reversal signal that often appears with expanding volatility. Learn how to identify this pattern and use ATR to set optimal stop-losses and profit targets around these high-probability reversal setups.
📊 Master Advanced Technical Analysis: Take your trading to the next level with our complete guide to Andrews pitchfork trading and median line analysis — learn how to identify trend channels and combine them with ATR for dynamic position sizing and stop-loss placement within trending markets.



 Signal2forex.com - Best Forex robots and signals


