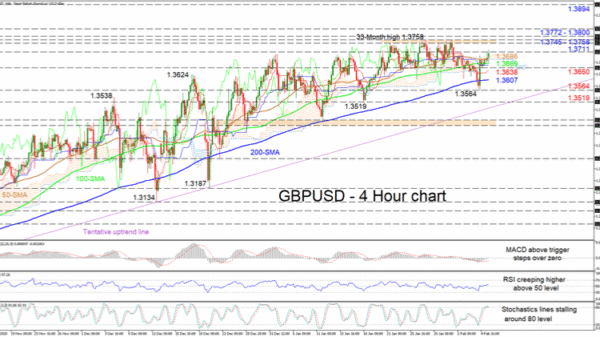
GBPUSD is currently stepping above the 50-period simple moving average (SMA) at 1.3686 after the price was violently catapulted from beneath the 200-period SMA at 1.3607. The price is sustaining a solid upwards force above the tentative trend line, drawn from the 1.2854 low in November last year.
Nonetheless, the directionless Ichimoku lines are reflecting a slightly slowed tempo in the ascent, which has struggled to overcome the 1.3745-1.3758 resistance ceiling, while the upwards crawling SMAs are defending the improving picture. The short-term oscillators also demonstrate a marginal pickup in positive sentiment. The MACD, above its red trigger line, is nudging over the zero threshold, while the RSI is rising in bullish territory. The stochastics are holding barely in overbought regions but otherwise have yet to confirm any negative tendencies in the price.
To the upside, if buyers manage to clearly push over the immediate barrier of 1.3711, they could jump to re-challenge the limiting ceiling of 1.3745-1.3758. In the event that this time they surpass this heavy boundary, next upside constraints could arise from the adjacent resistance zone of 1.3772-1.3800. Breaching this too, could fuel confidence in the pair sending buyers to exam the 1.3894 high from April 2018.
Alternatively, if selling interest increases, the bears may quickly encounter a congested region of support from the 50-period SMA until the 1.3650 low, which encompasses the 100-period SMA and the blue Kijun-sen line around 1.3669. Diving underneath this, the red Tenkan-sen line at 1.3638 could try to impede the drop from testing the 20-period SMA at 1.3607. Should the price sink even further, the 1.3564 and 1.3519 troughs accompanied by the supportive trend line could draw traders focus.
Summarizing, GBPUSD’s solid upwards trajectory since November last year remains intact as long as the price holds above the 200-period SMA, the 1.3564 trough and the ascending trend line.
 Signal2forex.com - Best Forex robots and signals


