When traders begin to study thetechnical analysis of price action, they will often be introduced to moving averages, which can be helpful in forecasting future price trends. Once traders understand moving averages, they can then apply two moving averages to a chart and find a potential entry point and exit based on a crossover. Here, we explore what moving average crossovers are, and how they can be utilized to inform decisions in the markets.
What is a moving average crossover?
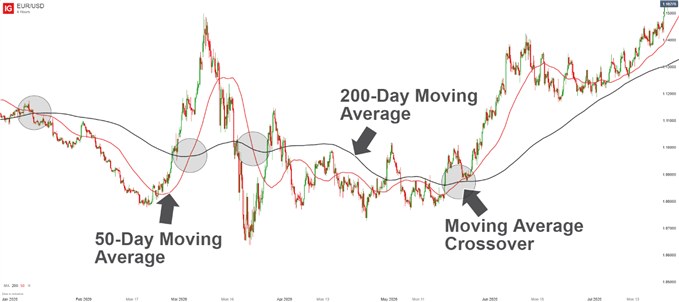
A moving average crossover refers to the point on a chart where there is a crossover of the shorter-term or fast moving average, above or below the longer-term or slowmoving average. Moving average crossovers can help traders identify trend patterns, including the direction in which price may be trending, where a potential entry point can be made, and if the potential is there for a trend to end or reverse.

As you can imagine, there is more than one type of moving average. Some moving averages, like the Exponential Moving Average, put more emphasis on the most recent price to help you react quicker to possible trend shifts. Whichever type of moving average you use, the rules for entries and exits remain the same.
Trading moving average crossovers
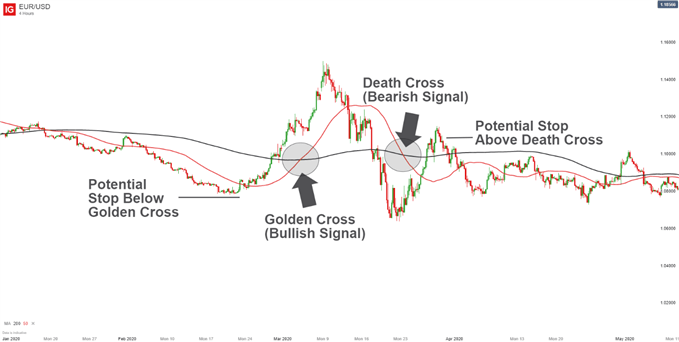
When it comes to trading moving average crossovers, most traders’ strategies start and end with timing entries and exits. This simple system has created names for crosses like the ‘Golden Cross’ – where a shorter-term moving average crosses above a longer-term one, and ‘Death Cross’, where the shorter-term moving average crosses below a longer-term one.
Markets tend to oscillate and trade within a well-defined range or trend. Traders soon learn that following trends has the potential to offer the most reward for the least amount of work, and moving average crossovers are a key part of that realization. The shorter and more reactive average is often the more accurate predictor of the direction the market could take.
Also of importance is that currencies and tradable instruments trend to varying degrees. However, when you find a currency pair that has a history of trending and you see a moving average crossover, you can then look to enter a trade with a well-defined risk by setting your stop above or below the crossover, as shown below.

Benefits and risks of using a Moving Average Crossover Strategy
One benefit of using a moving average crossover strategy is that traders can take objective signals that are reflective of market strength.
However, although this is seen as the simplest trading strategy, the Moving Average Crossover strategy for following trends is not without risk. The moving averages give equal weighting to all prices within the period selected when applying the indicator, so there is a lagging nature to the indicator’s ability to respond to changes in price. When there is a slower response time, this could mean that traders are sacrificing less reward and opening themselves up to greater risk. In short, you can’t forecast trends with moving averages – you can only learn about a trend that has already happened.
An example of this can be seen in the above chart, where the Death Cross represents a false signal this time as price reverses to the upside.
Another risk is using moving average crossovers in sideways markets, where stop losses won’t be effective. In general, crossover strategies on lower timeframes may not be the most advisable to use.
Moving Average Crossovers: A summary
Moving Average Crossovers bring the trader the benefit of time-confirmed trend entries and exits while avoiding whipsaws in prices that can hurt other traders who are too quick to act on a premature move. Because there can be a lot emotion behind trading and risking money, there is a natural benefit to an objective and simple strategy. If you’re a new trader, this could be a good place to start to give you the potential to catch the big moves.

 Signal2forex.com - Best Forex robots and signals


