Simple moving averages (SMA) and exponential moving averages (EMA) are two of the most popular technical indicators used by traders worldwide. This comprehensive guide explains the key differences between SMA and EMA, how each is calculated, and which moving average is best suited for your trading strategy in 2026.
1. SMA vs EMA: Understanding the Key Differences
Simple Moving Average (SMA) and Exponential Moving Average (EMA) are both trend-following indicators used to smooth price data and identify the direction of a trend. However, they differ significantly in how they are calculated and how they respond to price changes.
The primary difference lies in the weighting of data points. SMA gives equal weight to all prices in the period, while EMA gives more weight to recent prices. This fundamental difference affects how each indicator responds to new information and how traders use them in their strategies.
Both indicators are widely used across all financial markets — forex, stocks, commodities, and cryptocurrencies. Understanding the nuances between them is essential for selecting the right tool for your trading style.
📌 Key Insight: The choice between SMA and EMA is not about which is “better” — it’s about which is more suitable for your trading timeframe, style, and objectives. Each has its strengths and weaknesses.
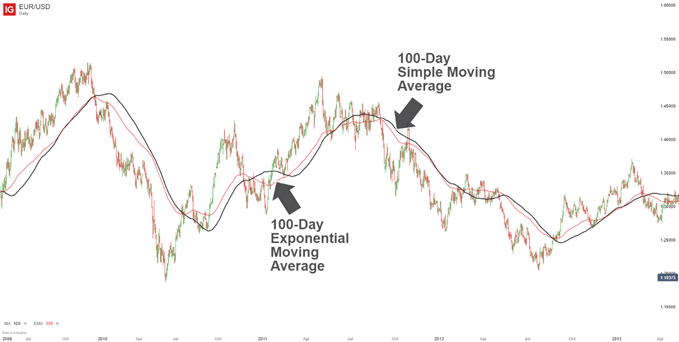
Fig 1: SMA vs EMA comparison — the EMA reacts faster to recent price changes, while the SMA provides a smoother, more stable line.
2. What Is a Simple Moving Average (SMA)?
A Simple Moving Average (SMA) is the arithmetic average of a set of prices over a specific number of periods. It is calculated by adding the closing prices of an asset over a certain number of periods (e.g., 10 days, 50 days, 200 days) and then dividing by the number of periods.
Calculation example: A 10-day SMA is calculated by adding the closing prices of the last 10 days and dividing by 10. Each price in the calculation is given equal weight, regardless of how recent or old it is.
Pros of SMA:
- Simplicity: Easy to understand and calculate
- Smoothness: Produces a smoother line with fewer false signals
- Reliability: Less prone to whipsaws in sideways markets
- Long-term trend identification: The 200-day SMA is widely used as a long-term trend filter
Cons of SMA:
- Lag: Responds slowly to rapid price changes
- Equal weighting: Gives the same importance to old and new prices
- Less responsive: Can be slow to signal trend changes
Best use cases for SMA:
- Long-term trend identification: The 200-day SMA is a classic trend filter
- Swing trading: 50-day and 100-day SMAs are popular for swing traders
- Support and resistance: SMAs often act as dynamic support and resistance levels
💡 Pro Tip: The 200-day SMA is one of the most widely followed technical indicators in the world. Many institutional traders and fund managers use it to determine the long-term trend of a market.
3. What Is an Exponential Moving Average (EMA)?
An Exponential Moving Average (EMA) is a type of moving average that gives more weight to recent prices and less weight to older prices. This weighting makes the EMA more responsive to new information and faster to react to price changes.
Calculation formula: The EMA is calculated using a multiplier that gives more weight to recent prices. The formula is: EMA = (Price × Multiplier) + (Previous EMA × (1 – Multiplier)). The multiplier is calculated as 2 ÷ (number of periods + 1).
Pros of EMA:
- Responsiveness: Reacts quickly to price changes
- Recent price focus: Gives more weight to what is happening now
- Short-term trading: Ideal for day trading and scalping
- Earlier signals: Can provide earlier entry and exit signals than SMA
Cons of EMA:
- More noise: Can produce more false signals in sideways markets
- Less smooth: More sensitive to price fluctuations
- Whipsaws: More prone to whipsaw signals in choppy conditions
Best use cases for EMA:
- Day trading: 9-day and 12-day EMAs are popular for intraday traders
- Short-term trading: Faster response to price movements
- Entry timing: Often used to time entries in the direction of the trend
📌 Key Insight: The EMA is often preferred by short-term traders because it reacts more quickly to price changes. However, this speed comes at the cost of more false signals in choppy markets.
4. SMA vs EMA: Which Moving Average Is Better?
The question “which is better, SMA or EMA?” has no single correct answer. The choice depends on your trading style, time horizon, and objectives. Here’s a direct comparison to help you decide:
| Feature | Simple Moving Average (SMA) | Exponential Moving Average (EMA) |
|---|---|---|
| Calculation | Equal weight to all prices in the period | More weight to recent prices |
| Speed of Response | Slower — reacts gradually | Faster — reacts quickly to price changes |
| Smoothness | Smoother, less noise | More responsive, more noise |
| False Signals | Fewer false signals | More false signals in sideways markets |
| Best For | Long-term trend identification, swing trading | Short-term trading, day trading |
| Popular Periods | 50-day, 100-day, 200-day | 9-day, 10-day, 12-day, 26-day |
| Lag | Higher lag | Lower lag |
When to use SMA:
- You are a swing or position trader with a longer time horizon
- You want to identify the overall trend without being distracted by short-term noise
- You are using the 200-day SMA as a long-term trend filter
- You prefer fewer false signals over faster signals
When to use EMA:
- You are a day trader or scalper with a short time horizon
- You need fast signals to capture quick price movements
- You are trading highly volatile markets
- You prefer responsiveness over smoothness
How to combine both:
Many professional traders use both SMA and EMA in their strategies. A common approach is to use the SMA for trend identification and the EMA for entry timing. For example, you might use the 200-day SMA to confirm the overall trend and a 10-day EMA to time your entries in the direction of that trend.
✅ Key Takeaway: Neither SMA nor EMA is universally “better.” The best choice depends on your trading style, timeframe, and market conditions. Experiment with both on a demo account to find what works best for you.
5. Moving Average Trading Strategies
Moving averages can be used in a variety of trading strategies. Here are four of the most effective and widely used approaches:
Strategy #1 — Golden Cross
The Golden Cross is one of the most famous moving average signals. It occurs when a short-term moving average crosses above a long-term moving average. The classic Golden Cross uses the 50-day SMA crossing above the 200-day SMA. This is considered a bullish signal that often precedes significant uptrends.
- Setup: 50-day SMA and 200-day SMA on a daily chart
- Entry: Buy when 50-day SMA crosses above 200-day SMA
- Stop-Loss: Below the 200-day SMA or recent swing low
- Take-Profit: Previous resistance levels or trailing stop
Strategy #2 — Death Cross
The Death Cross is the bearish counterpart to the Golden Cross. It occurs when a short-term moving average crosses below a long-term moving average. The classic Death Cross uses the 50-day SMA crossing below the 200-day SMA. This is considered a bearish signal that often precedes significant downtrends.
- Setup: 50-day SMA and 200-day SMA on a daily chart
- Entry: Sell/short when 50-day SMA crosses below 200-day SMA
- Stop-Loss: Above the 200-day SMA or recent swing high
- Take-Profit: Previous support levels or trailing stop
Strategy #3 — EMA Crossover (9/21)
This short-term strategy uses the 9-day EMA and the 21-day EMA to generate signals for day traders and swing traders. The 9-day EMA reacts quickly to price changes, while the 21-day EMA provides a slightly smoother signal.
- Setup: 9-day EMA and 21-day EMA
- Entry: Buy when 9-day EMA crosses above 21-day EMA; sell when 9-day EMA crosses below 21-day EMA
- Stop-Loss: Recent swing high/low
- Take-Profit: Next support/resistance level
Strategy #4 — Price vs Moving Average
This simple strategy uses price action relative to a moving average to determine trend direction. When price is above the moving average, the trend is considered up; when price is below the moving average, the trend is considered down.
- Setup: Choose a moving average (e.g., 50-day SMA, 200-day SMA, or 20-day EMA)
- Entry: Buy when price crosses above the MA; sell when price crosses below the MA
- Stop-Loss: Beyond the opposite side of the MA
- Take-Profit: Next support/resistance level
⚠️ Important: Moving averages are lagging indicators — they follow price rather than predict it. They work best in trending markets and can generate false signals in sideways or choppy conditions. Always use proper risk management.
6. SMA vs EMA Reference Table
Use this reference table to quickly understand key terms, compare SMA and EMA, and identify the best moving average for your trading style.
Part 1: Key Terms & Definitions
Part 2: SMA vs EMA Comparison
| Feature | Simple Moving Average (SMA) | Exponential Moving Average (EMA) |
|---|---|---|
| Calculation | Equal weight to all prices in the period | More weight to recent prices |
| Speed of Response | Slower — reacts gradually | Faster — reacts quickly to price changes |
| Smoothness | Smoother, less noise | More responsive, more noise |
| False Signals | Fewer false signals | More false signals in sideways markets |
| Best For | Long-term trend identification, swing trading | Short-term trading, day trading |
| Popular Periods | 50-day, 100-day, 200-day | 9-day, 10-day, 12-day, 26-day |
| Lag | Higher lag | Lower lag |
Part 3: Best Use Cases by Trading Style
| Trading Style | Recommended Moving Average | Reason |
|---|---|---|
| Day Trading | EMA (9, 12, 26) | Faster response to intraday price movements |
| Swing Trading | SMA (50, 100) | Smoother signals, filters noise |
| Position Trading | SMA (200) | Identifies long-term trend |
| Scalping | EMA (5, 9) | Maximum responsiveness to price changes |
| Trend Following | Combination (SMA + EMA) | SMA for trend, EMA for entry timing |
| Crossover Strategies | SMA (50/200) or EMA (9/21) | Classic crossover signals |
Part 4: Quick Reference Checklist
7. Frequently Asked Questions (FAQ)
What is the difference between SMA and EMA?
SMA gives equal weight to all prices in the period, while EMA gives more weight to recent prices. EMA reacts faster to price changes.
Which is better: SMA or EMA?
Neither is universally better. SMA is better for long-term trends and swing trading, while EMA is better for short-term trading and faster signals.
What is the 200-day moving average used for?
The 200-day SMA is used to identify the long-term trend. If price is above it, the trend is up; if below, the trend is down.
What is the golden cross?
A bullish signal that occurs when a short-term moving average (e.g., 50-day SMA) crosses above a long-term moving average (e.g., 200-day SMA).
What is the death cross?
A bearish signal that occurs when a short-term moving average crosses below a long-term moving average.
Can I use both SMA and EMA together?
Yes, many traders use SMA for trend identification and EMA for entry timing. This combination can improve trade accuracy.
Which moving average is best for day trading?
EMAs with shorter periods (e.g., 9-day, 12-day, 26-day) are best for day trading due to their faster response to price changes.
Which moving average is best for swing trading?
SMAs with longer periods (e.g., 50-day, 100-day) are best for swing trading as they provide smoother signals and filter out noise.
How do I calculate SMA and EMA?
SMA = (sum of closing prices) ÷ number of periods. EMA = (price × multiplier) + (previous EMA × (1 – multiplier)), where the multiplier gives more weight to recent prices.
Do moving averages work in all market conditions?
Moving averages work best in trending markets. They generate false signals in sideways or choppy markets, so it’s important to use them in conjunction with other indicators.
8. Conclusion
Simple Moving Averages (SMA) and Exponential Moving Averages (EMA) are two of the most essential tools in a trader’s arsenal. While both serve the same basic purpose — smoothing price data to identify trends — they differ significantly in their calculation and application.
Key takeaways from this guide:
- ✅ SMA gives equal weight to all prices; EMA gives more weight to recent prices
- ✅ EMA reacts faster to price changes; SMA is smoother with fewer false signals
- ✅ SMA is best for long-term trend identification and swing trading
- ✅ EMA is best for short-term trading and faster signals
- ✅ Golden Cross (50/200 SMA) is a bullish signal; Death Cross is bearish
- ✅ Combine SMA and EMA for more robust strategies
- ✅ Moving averages work best in trending markets and should be avoided in sideways conditions
📌 Final Advice: The key to successful moving average trading is understanding the strengths and weaknesses of each indicator and using them in the right market conditions. Experiment with both SMA and EMA on a demo account, develop a strategy that suits your trading style, and always use proper risk management.
Continue your trading education — explore the guides below to deepen your understanding of technical analysis and trading strategies.
📞 Need Help? Contact Us
Our support team is ready to assist you with any questions about moving averages, technical analysis, or our products and services.
📌 Support Hours: Our team is available 24/5 via WhatsApp, Telegram, and Live Chat. We respond to all inquiries within 24 hours on business days.
 Signal2forex.com - Best Forex robots and signals


