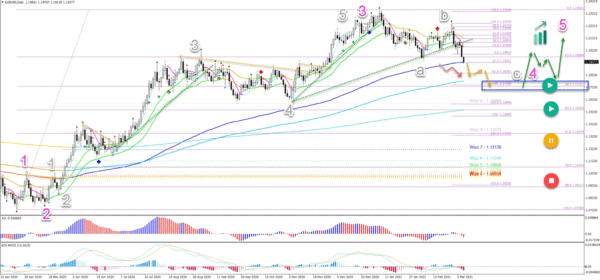
EUR/USD is clearly breaking the long-term support trend line and daily 21 ema zone. How important is this bearish breakout?
A downtrend was confirmed with the bearish breakout below the 21 ema zone, 23.6% support Fib, and support lines (dotted green).
On the 1 hour chart, the price action has reached the -27.2% Fibonacci target. This could create a wave 4 (blue) pullback now or next week.
Price charts and technical analysis
The EUR/USD bearish breakout was already anticipated in our ABC zigzag forecast. The only difference was that the wave 2 (orange) on the 1 hour chart ended sooner than expected.
- A downtrend was confirmed with the bearish breakout below the 21 ema zone, 23.6% support Fib, and support lines (dotted green).
- This confirms a new lower low and a bearish price swing. This is probably a wave C (grey) of a larger wave 4 (pink).
- The main target of the wave C (grey) is the 38.2% Fibonacci retracement level at 1.1730.
- A bullish bounce (green arrows) at the 38.2% or 50% Fib confirms the wave 4 (pink).
- A deeper bearish push places it on hold (yellow circle) or invalidates it (red circle).
On the 1 hour chart, the price action has reached the -27.2% Fibonacci target. This could create a wave 4 (blue) pullback now or next week.
- The current bearish impulse is typical for a wave 3 (blue).
- The pullback should remain shallow. A bearish break confirms the downtrend (orange arrows).
- The intermediate target for wave 3 (green) is 1.1836.The next target zone is at 1.1750.


 Signal2forex.com - Best Forex robots and signals


