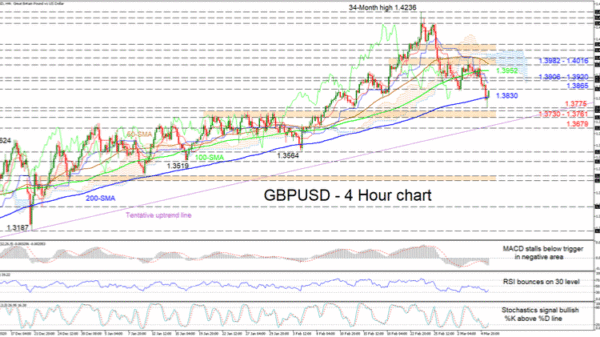
GBPUSD improved off the 200-period simple moving average (SMA) around 1.3830, after the correction from the 34-month peak of 1.4236 spiked below it and near the low of 1.3775. The Ichimoku lines are reflecting a pause in negative momentum, while the falling 50-period SMA is endorsing further bearish tendencies in the pair, which also previously had curbed price gains off the 1.3865 level.
The short-term oscillators are conveying an increase in positive momentum. The MACD, some distance below zero, is stalling beneath its red trigger line, while the RSI has bounced off the 30 level and is now rising. The stochastic %K line has pushed out of the oversold territory and over its %D line, promoting positive price sentiment.
Currently buyers are facing resistance from the 1.3865 obstacle (previous support-now-resistance) and should they step back above it, the next resistance could develop from the 1.3906-1.3920 region. Successfully climbing past this too, the bulls could then meet the 100-period SMA at 1.3952 before they encounter heavy resistance within the area of 1.3982-1.4016, reinforced by the 50-period SMA.
If sellers retake control and steer the pair below the 200-period SMA at 1.3830, first hindrance could arise from the 1.3775 mark prior to the adjacent support section of 1.3730-1.3761. In the event the pair deteriorates further, the tentative support line drawn from the 1.2854 low could try to defend the bullish structure before the decent hits the 1.3679 trough.
Overall, GBPUSD’s bullish outlook seems to be intact above the ascending line and the 1.3730-1.3761 key support zone, despite the recent correction.


 Signal2forex.com - Best Forex robots and signals


