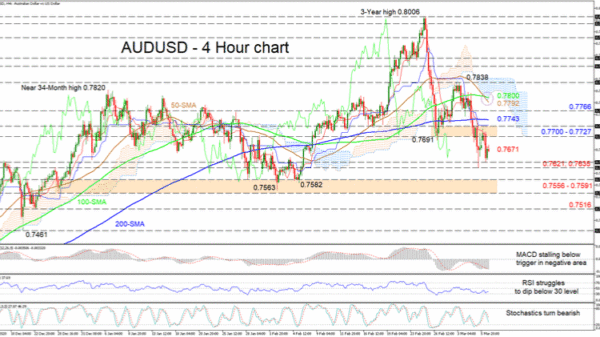
AUDUSD’s intact negative trajectory, from a 3-year high reached at the end of February, has paused around the area between the latest lows of 0.7621 and 0.7635 respectively. The falling red Tenkan-sen line is assisting the price dive beneath the 200-period simple moving average (SMA), while the flattening blue Kijun-sen line is reflecting a pause in the downwards price move.
The bearish crossover between the falling 50-period SMA at 0.7792 and the 100-period SMA at 0.7800 is endorsing a deeper drop in the price.
The short-term oscillators are indicating the recent pickup in positive momentum but seem to be favouring the downside. The MACD, residing some ways in the bearish region, is barely below its red trigger line, while the RSI was deprived of its recent attempts to slide below the 30 level. However, the stochastic oscillator is sustaining a negative charge and its %K line is promoting further weakening in the pair.
If sellers resurface, early constraints could develop from crucial neighbouring lows of 0.7635 and 0.7621 respectively. However, successfully steering the price underneath these barriers, the next significant obstacle the bears may encounter is the support base of 0.7556-0.7591. In the event the pair sinks below this hardened region, the next support could be found at the 0.7516 mark.
If buyers clearly overstep the red Tenkan-sen line at 0.7671, the price could jump to challenge the resistance section of 0.7700-0.7727. Subsequent to this is the 200-period SMA hovering slightly above at 0.7743, which if overrun may reinforce belief in a bullish move, triggering the test of the 0.7766 barrier, the 50- and 100-period SMAs and the Ichimoku cloud.
Summarizing, buyers’ attempts to make a comeback may be in vain should they fail to return the price above the 200-period SMA at 0.7743. Ultimately, the pair is sustaining its bearish demeanour below the SMAs and the 0.7700-0.7727 region, while a climb above 0.7838 could reboot the positive outlook.


 Signal2forex.com - Best Forex robots and signals


