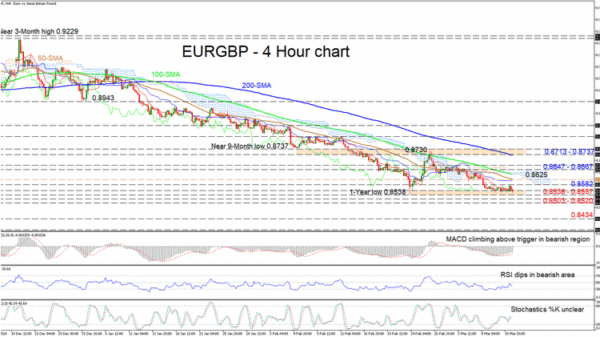
EURGBP is currently crawling across the floor of 0.8538-0.8557, the latter being a 1-year low on February 24, where the pair rejected the level. The gliding simple moving averages (SMAs) are dictating the bearish picture, while the flattening Ichimoku lines are reflecting the dry-up in negative momentum, echoing the price’s struggles to dive deeper.
The short-term oscillators are reflecting conflicting signals in directional sentiment. The MACD, in the negative region, is improving above its red trigger line, while the RSI is weakening below the 50 level. The stochastic oscillator for the moment is not promoting any clear direction in the price.
To the downside, negative pressures continue to be muted by the support base of 0.8538-0.8557, keeping the bears at bay. However, if selling interest intensifies and the pair pierces below this floor, sellers could then target the neighbouring support section of 0.8503-0.8520. Conquering this boundary as well, the pair could then plunge towards the 0.8434 barrier.
Otherwise, a clear foothold at this bottom faces initial resistance at the 0.8582 obstacle ahead of a zone of resistance from the 50-period SMA at 0.8605 until the Ichimoku cloud at 0.8625. Pushing over the 100-period SMA, the bulls could then encounter upside constrictions in the vicinity of 0.8647-0.8667.
Summarizing, EURGBP‘s bearish picture continues to overwhelm below the 200-period SMA and the 0.8713-0.8737 buffer zone.


 Signal2forex.com - Best Forex robots and signals


