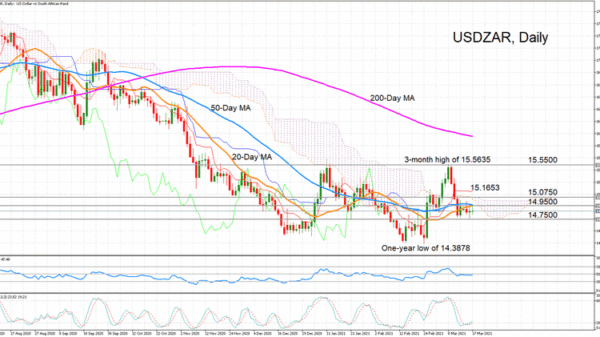
USDZAR remains stuck in a sideways range both in the short and medium terms, with prices struggling to gain traction below the thin Ichimoku cloud. Aside from the cloud bottom posing a major obstacle in the 15.0750 region, the bulls are additionally facing resistance around 14.9500 where the 20-day moving average (MA) is about to cross above the 50-day MA.
Once this bullish crossover is completed, the weak positive momentum – as indicated by the positively sloped stochastics – could strengthen, empowering buyers to push the pair above the cloud and into the 15 handle. If successful, the Tenkan-sen line at 15.1653 could thwart further advances. However, the bigger challenge will be the strong resistance zone around 15.5500, which twice halted upside moves, the last being earlier this month when prices peaked at 15.5635.
If USDZAR is able to overcome this top, it could set the pair on a more positive path, shifting the medium-term picture from neutral to bullish. However, if the 20- and 50-day moving averages continue to cap prices like they have done over the last few sessions, the next trend direction could be downwards.
The RSI is flat just below the 50-neutral level, while the stochastics are barely out of oversold territory. Thus, the near-term bias could easily turn negative if price action is stuck below the 15-level for much longer, and in particular, if the key support region near 14.7500 is broken. A drop below 14.7500 would bring the February trough of 14.3878 into the spotlight and risk a resumption of the longer-term downtrend that began in April 2020.


 Signal2forex.com - Best Forex robots and signals


