European vaccines will soon be on the move! As discussed yesterday in analysis of EUR/GBP, the European Union expects to have a majority of its citizens vaccinated by the end of June, which ideally could lead to heard immunity sooner than expected for Europe. In addition, although the European Medicines Agency (EMA) found a possible link to very rare cases of unusual blood clots with low blood platelets, they have confirmed that the total benefit-risk remains positive on the AstraZeneca shot. (However, the same time, the UKs medical regulator warned that people aged 18-29 should not use the AstraZeneca vaccine for the same reason). All of this is good news for the Euro as the currency has been depressed lately vs many currencies on news of lockdowns, restrictions, and the slow vaccine rollout. Australia and New Zealand have handled the coronavirus situation particularly well. With the positive European vaccine news, the Euro has some catching up to do vs their currencies!
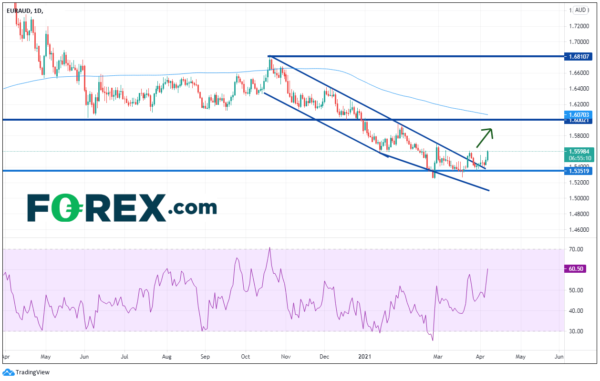
EUR/AUD had been moving lower since October 2020 in an orderly channel formation. At the beginning of 2020, the pair began making higher lows (holding horizontal support from November 30th, 2018), forming a descending wedge. In late March, the pair broke above the top downward sloping trendline of the wedge, pulled back to retest the trendline, and today is pushing higher once again.
Source: Tradingview, FOREX.com
On a 240-minute timeframe, EUR/AUD recently broke above a symmetrical triangle and is testing horizontal resistance and the 50% retracement level from the January 29th highs to the February 24th lows, near 1.5600. The 61.8% Fibonacci retracement level sits just above and acts as then next level of resistance near 1.5683. Above there, price can run up to the January 29th highs near 1.5947. However, note that the RSI has moved to overbought territory while price is at resistance on the 240-minute timeframe, indicating the pair may pullback. Support is back at the top triangle trendline near 1.5550. Below there is the bottom upward sloping trendline near 1.5455, then the long-term downward sloping trendline (from the daily) and horizontal support near 1.5350.
Source: Tradingview, FOREX.com
A chart of EUR/NZD looks very similar to that of EUR/AUD. The pair had been moving lower and broke out of a descending wedge on March 23rd. EUR/NZD then traded up to the 38.2% Fibonacci retracement level from the October 20th, 2020 highs to the February 24th lows, near 1.6971. After a brief pullback, the pair is on the move again and looking to retest those previous highs. Horizontal resistance above there is near 1.7061 and then the 50% retracement from the same time period , near 1.7134.
Source: Tradingview, FOREX.com
The resistance is similar on the daily and the 240-minute timeframes, however, the support levels are clearer on the shorter timeframe. As with EUR/AUD, the RSI on the 240-minute chart is near overbought conditions. The April 5th lows act as first support near 1.6656, followed by the downward sloping trendline near 1.6500, and then the February 24th lows near 1.6323.
Source: Tradingview, FOREX.com
If the vaccine news out of Europe continues to be positive, the Euro may continue to move higher vs many of its counterparts, as the currency has been so depressed lately. However, if lockdowns get extended past the end of April or if the vaccine news takes a turn for the worse, the Euro may once again come under pressure.


 Signal2forex.com - Best Forex robots and signals


