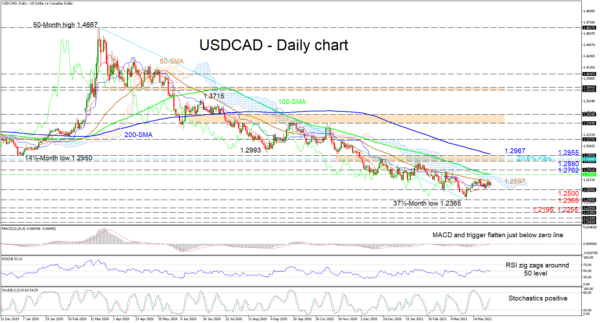
USDCAD is struggling to tick higher after its recent positive propulsion off the 37½-month low of 1.2365. The descending simple moving averages (SMAs) are imposing the predominant bearish bias. Additionally, the fairly neutral demeanour of the Ichimoku lines is suggesting a phase where positive sentiment has become subdued, further tilting the scale in favour of the downside.
Clearly positive momentum has significantly faded and this is being conveyed in the short-term oscillators as well. The MACD and the red trigger line are flat at the zero mark, while the RSI is flirting persistently with the 50 level, indicating weak commitment in a price direction. However, the stochastic oscillator is sustaining a positive charge, endorsing improvements in the pair.
If buying interest increases, immediate heavy resistance could stem from the 50-day SMA at 1.2597 until the 100-day SMA at 1.2700 – an area surrounding the Ichimoku cloud. That said buyers’ efforts to improve would need to extend past the high of 1.2762 lingering overhead, to draw any attention. Even so, the igniting catalyst for belief in a more profound correction remains to be the resistance section of 1.2880-1.2955. Yet, it is apparent that this region is reinforced by the 1.2908 level, which is the 23.6% Fibonacci retracement of the down leg from 1.4667 to 1.2365, and the adjacent 200-day SMA at 1.2967.
If the capping 50-day SMA and the cloud hold up, sellers may revive negative pressures by steering the price beyond the Ichimoku lines and the 1.2500 handle. However, attempts to limit the decline could arise again at the multi-year low of 1.2365. Successfully sinking beneath this floor, next support may be linked to the region between the 1.2255 trough and the 1.2195 low, from September 2017 and February 2018 respectively.
Summarizing, USDCAD is exhibiting a neutral-to-bearish tone, which is looking increasingly negative.


 Signal2forex.com - Best Forex robots and signals


