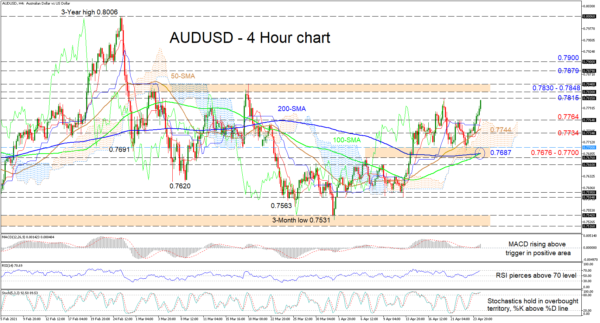
AUDUSD came just shy of the 0.7815 high achieved on April 20, after the pair found positive traction within the support zone of 0.7676-0.7700. The climbing 50- and 100-period simple moving averages (SMAs) on the four-hour chart are endorsing the price gains from the 0.7584 trough. Furthermore, the recent completion of a bullish crossover of the 200-period SMA by the 100-period one, may fuel additional improvements in the pair.
The rising red Tenkan-sen line is reflecting the pickup in momentum and the short-term oscillators are also favouring the upside. The MACD, in the positive region, is strengthening above its red trigger line, while the RSI has peeped over the 80 level. The stochastic lines are persisting in overbought territory and the %K line has yet to confirm any significant price pullback.
Maintaining the current trajectory, resistance may originate from the immediate 0.7815 high. If the pair continues to log green candles and steps above the 0.7815 obstacle, a nearby resistance section of 0.7830-0.7848 may challenge buyers’ efforts to gain extra ground. Should the bulls conquer this boundary too, they could then propel for the 0.7879 barrier and the 0.7900 hurdle.
If sellers manage to regain control, initial support may commence from the red Tenkan-sen line around 0.7764 until the 50-period SMA at 0.7744. If the price retracts below the 0.7734 low as well, the pair may then sink to test a key support base from the Ichimoku cloud’s lower band at 0.7700 until the 0.7676 mark, a zone that is reinforced by the bullish intersection between the 200- and 100-period SMAs.
Summarizing, AUDUSD is looking increasingly bullish above the SMAs and the cloud. A price retraction below 0.7676 may start to weigh on the pair’s bullish tone.


 Signal2forex.com - Best Forex robots and signals


