WTI steadies after steep selloff, Baker Hughes rig count in focus
WTI is consolidating losses as it trades at its lower level in around a month
WTI saw a deep sell off across the week amid reports of progress in Iran – US nuclear talks. An agreement could see sanctions on Iran lifted and their oil come flooding back to the market.
Rising covid cases in Asia and the impact on demand have been overshadowing re-opening optimism in the West
However, oil is finding support following upbeat US jobless claims and whilst a truce between Israel & Palestine appears to be adding to the improved sentiment.
Looking ahead PMI data and the Baker Hughes rig count will be in focus.
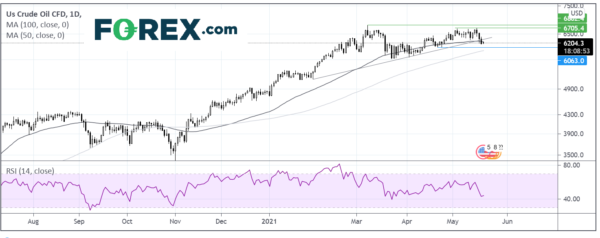
Where next for WTI crude oil ?
Oil has broken below its ascending trendline dating back to February at 63 and below its 50 sma on the daily chart at 62.50 and also closed below these levels which will keep sellers hopeful. Support can be see around 60.70 swing low in late April ahead of the key 60.00 psychological level and the 100 sma around 59.50.
Any recovery would need to retake the 50 sma and ascending trendline in order to look towards 67.00 the May high and 68.00 the yearly high.
EUR/GBP with EZ & UK PMIs in focus
UK retail sales unexpectedly jump 9.2% MoM in April versus 4.5% expected. On an annual basis retail sales rise 42.4% against 36.8% expected.
Sales surge as the UK economy reopened.
Optimism surrounding the easing of lockdown restrictions is underpinning the Euro, in addition to a softer tone surrounding the US Dollar.
UK and Eurozone PMI data are due.
Where next for EUR/GBP?
EUR/GBP has been on the rebound picking up firmly from weekly lows of 0.8560, reaching a high on Wednesday at 0.8630.
The pair trades above its ascending trendline dating back to early April, keeping the bulls hopeful. It also trades above its 50 sma on the 4 hour chart. If the price breaks above the 100 sma buyers could gain traction towards 0.8660 high May 10 and on to 0.87 the May 6 high.
On the flipside, the MACD looks like it could be starting to form a bearish cross over and read below the midline. A further downtick in the indicator could see sellers target 0.8608 the 50 sma ahead of 0.8580 low May 17.
 Signal2forex.com - Best Forex robots and signals


