There are many events this week which could cause volatility in CAD/JPY including the BOC, BOJ, and US inflation data
The Bank of Canada meets this week and there is one question on traders’ minds: Will the BOC continue tapering or will they remain on hold? Recall that at the April 21st meeting, Canada’s central bank surprised markets by cutting bond purchases from 4 billion Canadian Dollars down to 3 billion Canadian Dollar. However, at their June 9th meeting, they left purchase amounts unchanged as the BOC waited for more data. The Canadian Employment Change for June released on Friday showed that 230,700 jobs were added to the economy, though all the gain was in part-time jobs. The Unemployment Rate fell from 8.2% to 7.8% while Average Hourly Earnings YoY rose from -1.4% in May to +0.1%. Can this data help the BOC with their decision? Markets expect the Bank of Canada to cut bond purchases once again by another 1 billion Canadian Dollars. This would bring totally weekly purchases down to only 2 billion Canadian Dollars! Also, at the June meeting the BOC said that they expect economic slack to be absorbed in the second half of 2022. Watch to see if they revise the timing, which could increase rate hike expectations.
The BOJ also meets this week. With the Summer Olympics less than 2 weeks away, Japan has imposed a fourth State of Emergency on Tokyo due to the continued spread of the coronavirus. This time, it’s the Delta variant. Could this affect the BOJ’s decisions (although it seems they are running low on options). At their last meeting, the BOJ maintained the target for the 10-year bond at 0% and extended their deadline for the pandemic relief fund by 6 months. Japan’s recent data has been mixed; however, inflation is stagnant. Oil prices are helping to keep inflation near 0%. Monday’s release of Machinery Orders (MoM) for May was strong though, at 7.8% vs 2.6% expected and 0.6% in April! But with little that the BOJ can do, fiscal policy will be watched for additional budgets. With the pandemic continuing and vaccinations low, watch for lower revisions to growth and inflation forecasts.
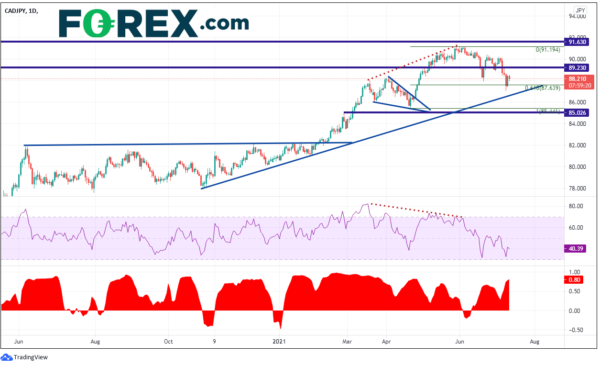
On a daily timeframe, the CAD/JPY had moved higher since putting in pandemic lows in March 2020, near 73.80. The pair then traded sideways from June 2020 to February 2021 between 77.60 and 81.91. As yields began moving higher in February of this year, so did CAD/JPY. The pair formed a rising triangle and broke out on February 5th, on its way to June 1st highs near 91.19. Notice that between March 28th and June 1st, the RSI diverged with price which is an indication that a reversal was ahead. The pair has since pulled back to the confluence of the 61.8% Fibonacci retracement level from the low on April 21st to the high on June 1st, along with an upward sloping trendline near 87.10. The correlation coefficient between CAD/JPY and the US 10-year yield is currently +0.80. This indicates a strong positive correlation between the 2 assets.
Source: Tradingview, FOREX.com
Last week, Yen pairs had mainly following yields lower. CAD/JPY was no exception. On July 6th, CAD/JPY was trading at 90.10. By the afternoon on July 8th, the pair was at 87.10 before profit taking came in ahead of the weekend. (US 10-year yields were in a similar situation moving from 1.447 down to 1.250 before bouncing. Resistance in CAD/JPY is at today’s highs near 88.56. July 7th highs above there are at 89.12 and then a confluence of resistance between a downward sloping trendline and horizontal resistance between 89.60 and 89.85. Horizontal support is at 87.73 and the July 8th lows of 87.10. If price breaks below, it could then fall to horizontal support near 86.80.
Source: Tradingview, FOREX.com
There are many events this week which could cause volatility in CAD/JPY. These include the BOC meeting, the BOJ meeting, and the ongoing pandemic. In addition, continued volatility in US yields could cause the pair to move (which could be caused be US CPI, PPI, and Powell’s testimony this week).


 Signal2forex.com - Best Forex robots and signals


