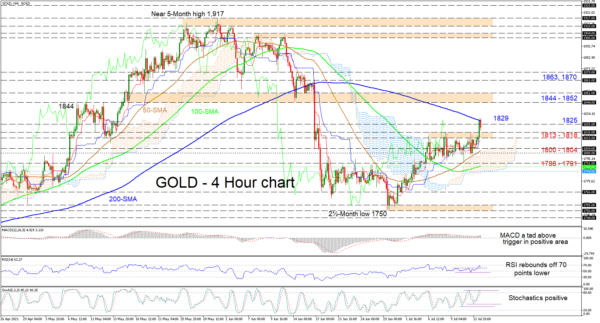
Gold’s recent surge in positive impetus has been capped by the 200-period simple moving average (SMA) at 1,829. Sellers seem to have gained the upper hand, steering the price back underneath the 1,825 level (previous resistance-now-support). In spite of the downward bearing of the 200-period SMA, the bullish 50- and 100-period SMAs continue to underpin the commodity’s recent progress.
The Ichimoku lines are indicating feeble upward drive, while the short-term oscillators are conveying mixed signals in directional momentum. The MACD is holding above its red trigger line, while the RSI has deflected off the 70 overbought level. The stochastic oscillator also seems to be struggling to sustain its positive charge, suggesting upward forces may be lacking.
If sellers stay in charge, initial downside constraints could occur around the 1,813-1,818 area, shaped by the recently conquered highs. Should the price retreat further, a vital support zone from the 1,804 low until the 1,800 barrier could come under the spotlight. Additional fading in the price below the 50-period SMA could sink it to test a support belt, moulded between the 1,791 trough and the 100-period SMA at 1,788.
Alternatively, a convincing thrust above the 200-period SMA at 1,829 may encourage buyers to challenge the resistance border of 1,844-1,852. Furthermore, triumphing over this critical boundary could significantly bolster upside momentum, with the price targeting the mid-June highs of 1,863 and 1,870 respectively.
Summarizing, gold’s advances remain subdued in the short-term picture by the 200-period SMA at 1,829. That said, a break above the 200-period SMA may be the catalyst for additional improvements, while a break below the 100-period SMA may reinforce negative tendencies.


 Signal2forex.com - Best Forex robots and signals


