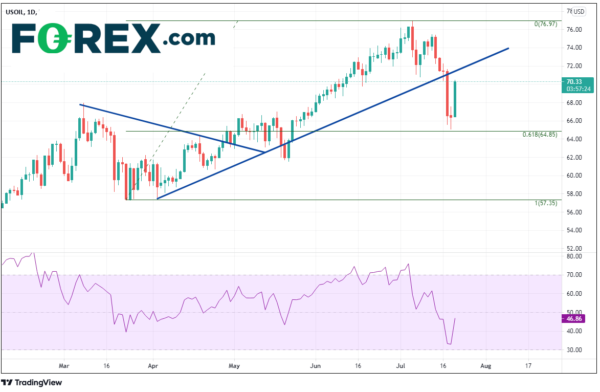
During Q2 of this year, Crude Oil (USOIL) had been on a tear moving from a low on March 24th of 57.28 to a high on July 6th at 76.95. Along the way, the black gold broke out of a symmetrical triangle in late April and hadn’t looked back! However, as an OPEC+ deal came and went without a new deal on supply increases, markets became nervous and began pulling back on the uncertainty. Last weekend, the group finally reached a consensus: an increase of 400,000 barrels per day which will extend through September 2022. Throw in the uneasiness from a possible decrease in demand due to increases in new daily cases of the coronavirus around the world, and it made a recipe for disaster. When the markets opened Monday, crude broke through a rising trendline from April 5th and traded down 7%.
Price fell to the 61.8% Fibonacci retracement level from the lows to March 24th to the highs of July 6th, near 64.85. However, despite EIAs and APIs showing a build in supply of oil for last week, today crude is rallying and taking out stops along the way! Resistance is above at the recently broken upward sloping trendline near 71.66, ahead of the July 13th and July 6th highs at 75.47 and 76.95, respectively.
As Crude Prices had been moving higher over the past year, USD/CAD had been moving lower. Canada is an oil export-led country and the price of crude affects the price of the Canadian Dollar. Therefore, USD/CAD trades inversely to crude. In June, the pair decoupled from Crude as the 2 assets began moving in the same direction (higher). USD/CAD briefly broke below a descending wedge, before reversing and testing the opposite side of the wedge. The pair finally broke out in earnest on June 29th and continued higher, just as crude oil began pulling back (orange line).
Despite the Bank of Canada tapering bond purchases from C$3 billion per week to C$2 billion per week at their last meeting, USD/CAD had continued to rise as crude was falling and the relationship between crude oil and USD/CAD fell back into favor. USD/CAD is having its biggest daily selloff since May 6th, as the pair appears to be tracking the price of crude oil, which is up nearly 6% today. Support in USD/CAD is at the 38.2% Fibonacci retracement level from the lows on June 1st to the highs on July 19th, near 1.2500. Horizontal support and the 50% retracement level are just below near 1.2495/1.2415. Resistance is at the 200 Day Moving average near 1.2620, horizontal resistance at 1.2748, and the July 19th highs or 1.2808.
Given the lack of positive fundamental news in Crude Oil today, the price action appears to be the result of “a good old fashion short squeeze”. If that is indeed the case, price may reverse and continue lower. However, whether the price of crude moves higher or lower, USD/CAD traders should be aware and use the movement to their advantage!
 Signal2forex.com - Best Forex robots and signals


