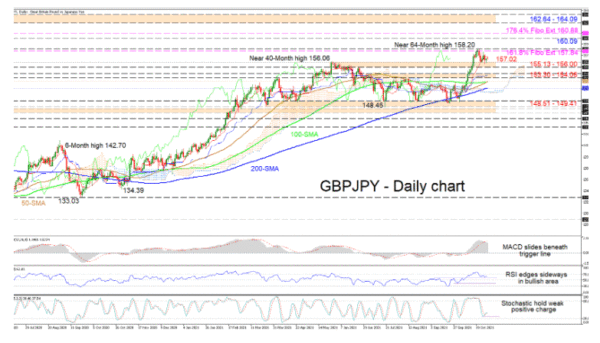
GBPJPY is consolidating across the 156.00 mark that is the upper part of a support barrier moulded by the highs reached at the end of May until the later part of June. The simple moving averages are sponsoring the positive structure, while a further extension of the 50-day SMA above the 100-day SMA could boost advances in the pair.
The Ichimoku lines are reflecting the minor pullback in the pair but are also showing that positive momentum may just be taking a breather. The short-term oscillators are demonstrating that buying interest has not fully subsided. The MACD has glided underneath its red trigger line but remains deep in the positive zone, while the RSI is hovering in bullish territory. The stochastic oscillator is exhibiting a weak positive charge but is not conveying a strong price preference in the pair.
Managing to push the price above the red Tenkan-sen line at 157.02, buyers could target the 157.84-158.20 resistance band, the former being the 161.8% Fibonacci extension of the down leg from 144.94 until 124.00. Conquering the latter, which is a more than 5-year high, the bulls could jump for the key high of 160.09 from back in June 2016. If upside impetus persists and thrusts the price past the 176.4% Fibo extension of 160.88, buyers may then challenge the 162.64-164.09 resistance boundary linked to the highs plotted over the 2016 period of March until May.
If downward forces grow, initial support could stem from the immediate 155.13-156.00 zone. Next, the 153.30-154.06 obstruction could come into focus before the section from the 50-day SMA at 152.76 until the 200-day SMA at 151.60 tries to dismiss the decline from gaining pace. From here, a price drop below the Ichimoku cloud around 150.86 could feed negative powers to test the foundation of 148.51-149.41.
Summarizing, although elevating forces have softened somewhat, GBPJPY’s bullish bearing remains in force above the 155.13-156.00 barrier. That said, a price dip below the SMAs could see negative concerns increase.


 Signal2forex.com - Best Forex robots and signals


