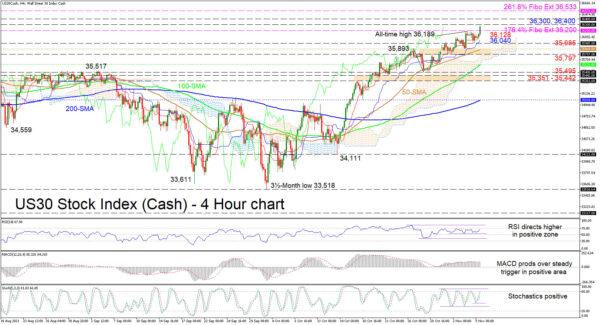
The US 30 stock index (Cash) has pushed past the 36,200 level, that being the 176.4% Fibonacci extension of the down leg of 35,893 until 35,495, which had capped recent advances, keeping the all-time high at 36,189. The index has now regained buoyancy after a minor pullback and is now heading for the resistance of 36,300. The advancing simple moving averages (SMAs) are endorsing the uptrend in the index.
Moreover, the bullish Ichimoku lines are confirming that positive forces are bolstering, while the short-term oscillators are looking skewed to the upside. The MACD, in the positive region, has nudged over its red trigger line, while the RSI is rising towards the 70 level. The positively charged stochastic oscillator is also promoting bullish moves in the pair.
If buyers stay in charge, preliminary resistance could transpire from the 36,300 and 36,400 respective barriers. Overstepping these obstacles, the bulls may then pilot the price to challenge the 261.8% Fibo extension of 35,533.
However, if upside momentum starts to wane, the price of the index could encounter some support from the Ichimoku lines at 36,128 and 36,040 prior to the 35,945 nearby low. Losing some more ground, the price may then meet a support zone from the 50-period SMA at 35,889 until the 35,797 obstacle, which overlaps with the Ichimoku cloud. From here, a deeper retracement could find footing on the approaching 100-period SMA at 35,626, otherwise the price may dive to test the 35,495 trough and the adjacent support border of 35,351-35,442.
Summarizing, the US 30 index is pushing into uncharted waters again and should remain bullish if the price persists above the SMAs and the trough at 35,495. That said, a price dip below the 35,985 low could signal that sellers are fighting back.


 Signal2forex.com - Best Forex robots and signals


