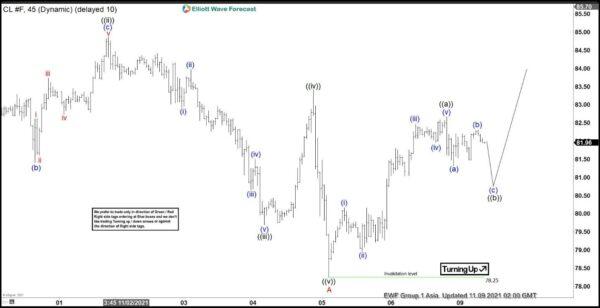
Short-term Elliott wave view in Oil (CL) suggests the decline from Oct 25, 2021 peak is unfolding as a zigzag Elliott Wave structure. Down from Oct 25, wave ((i)) ended at 80.58 and bounce in wave ((ii)) ended at 84.88. The commodity then extends lower in wave ((iii)) towards 79.69 and bounce in wave ((iv)) ended at 83.42. Last leg lower wave ((v)) ended at 78.25 which completed wave A of the zigzag.
Wave B rally is in progress with internal division as another zigzag Elliott Wave structure in lower degree. Up from wave A, wave (i) ended at 80.17 and pullback in wave (ii) ended at 78.96. Oil then extends higher in wave (iii) towards 82.47, and dips in wave (iv) ended at 81.96. Final leg higher wave (v) ended at 82.67 which completed wave ((a)) of B. Pullback in wave ((b)) is in progress to correct the cycle from November 5 low before Oil resumes higher in wave ((c)) of B. Near term, as far as pivot at 78.25 low remains intact, expect dips to find support in 3, 7, or 11 swing before the next leg higher.
Oil (CL) 45 Minutes Elliott Wave Chart


 Signal2forex.com - Best Forex robots and signals


