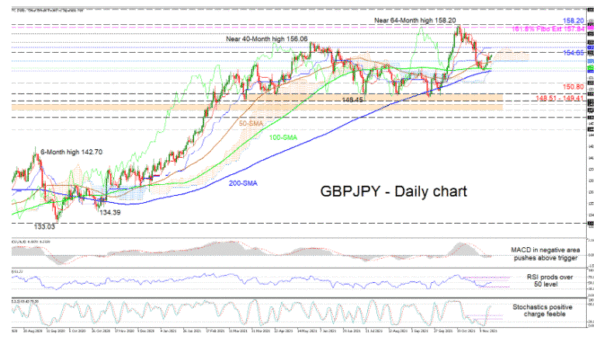
GBPJPY is recouping some lost ground from the pullback off the near 64-month peak of 158.20. The longer-term 200-day simple moving average (SMA) is endorsing the positive structure in the bigger picture, while the rising 50-day SMA is promoting the recent progress in the pair.
The Ichimoku lines are not conveying any ruling directional forces at present, while the short-term oscillators are reflecting conflicting messages in momentum. The MACD, below the zero mark, has nudged above its red trigger line indicating that negative momentum is fading. The RSI is pointing upwards and has pierced above the 50 level. That said, the stochastic %K line is turning downwards, showing some vulnerability in bullish action in the pair.
In the positive scenario, resistance could commence from the nearby 154.65 barrier and the neighbouring blue Kijun-sen line at 155.30. Pushing higher, the bulls could aim for the 156.00 and 157.00 hurdles respectively, before challenging a resistance zone established by the 157.84 and 158.20 barriers. The former happens to be the 161.8% Fibonacci extension of the down leg from 144.94 until 124.00 and the latter the more than five-year high.
If sellers resurface and drive the price downwards, prompt support could emanate from the 50-day SMA currently inline with the Ichimoku cloud’s lower band at 153.59. Dipping back beneath the cloud, a zone of support may develop between the 100- and 200-day SMAs at 152.70 and 152.34 respectively. Should these averages fail to act as an upside defence, the price could then dive towards the 150.80 low, while a deeper decline could challenge the base of 148.51-149.41.
Summarizing, GBPJPY is gaining buoyancy above the cloud and the SMAs. That said, price improvements are not yet severe enough to eliminate the doubt surrounding the bullish action in the pair.


 Signal2forex.com - Best Forex robots and signals


