Non-Farm Payrolls from the US for November were +210,000 vs an expected increase of 550,000. October’s print was revised slightly higher from +531,000 to +546,000. Unemployment number dropped from 4.6% to 4.2% in October. Expectations were for a drop to 4.5%. This may be the biggest takeaway from the data. Why? Because it dropped by such a large amount with an increase in the labor force participation rate from 61.6% to 61.8%. Average Hourly Earnings missed slightly, with a print of 0.3% MoM vs 0.4% MoM expected.
Despite the bad print in the Non-Farm Payroll data, this is likely to mean little to the FOMC committee when they meet on December 14th and 15th. The Fed is likely to focus on the inflation component when deciding to raise interest rates. The Fed has told us that both inflation and maximum employment goals have been achieved. However, Powell testified earlier in the week that he is retiring the word “transitory” and that the FOMC would discuss increasing the pace if tapering at their next meeting. Therefore, traders have been led to believe that inflation is the focus, not jobs. Also, the Omicron variant of the virus will be in the forefront of their minds!
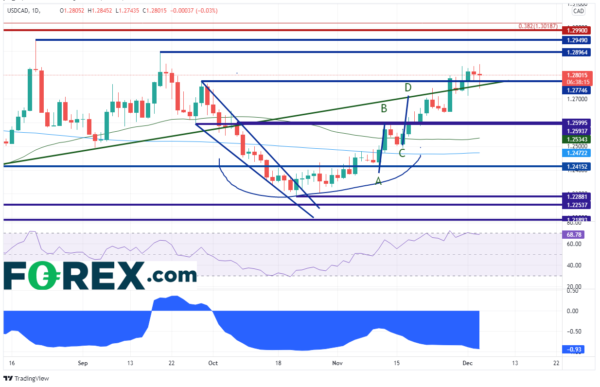
USD/CAD has been hovering around horizontal support (former highs) at 1.2775 for the last 5 trading days. With Crude falling aggressively since late October, its no wonder that USD/CAD has been bid. Notice that the correlation coefficient between USD/CAD and Crude Oil is -0.93. This is a strong negative correlation which indicates that when one asset moves higher, the other moves lower. It is also sitting just above an upward sloping trendline dating back to July (green line). Resistance at previous highs near 1.2896 (and the top trendline of a channel on the 60 minute) and 1.2949. However, 1.2990 (red line) has been an important level for traders going back to pre-covid.
Source: Tradingview, Stone X
By the way, Canada also released jobs data today, and it was MUCH better than expected, at +153,700 vs +35,000 expected. The Unemployment Rate dropped from 6.6% to 6%! As a result of the simultaneous data release, USD/CAD fell from 1.2826 down to the bottom trendline of the upward sloping channel on the 60-minute timeframe that the pair has been in since early November, near 1.2744. However, crude and the US Dollar remain the driver. With the US Dollar bid since the data, USD/CAD has been bid as well. 1.2810 is intraday resistance ahead of the day’s highs at 1.2845. Below the bottom trendline, are numerous levels of horizontal support down to the channel lows. The first levels are 1.2713 and 1.2677.
Source: Tradingview, Stone X
Although the headline print was weaker than expected, it shouldn’t matter to the FOMC when they meet in mid-December. Inflation and the Omicron variant of the coronavirus will be more in focus as the committee decides if they should increase the pace of tapering or not!


 Signal2forex.com - Best Forex robots and signals


