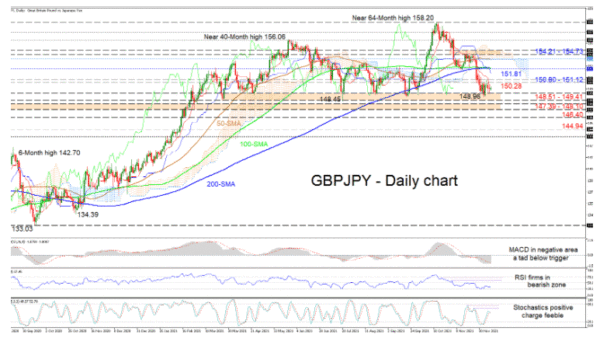
GBPJPY has once again found its feet around the critical 148.51-149.41 support base after a six-week decline from the more than 5-year high of 158.20. The steadier simple moving averages (SMAs) are endorsing a more sideways market in the near-term.
That said, the falling Ichimoku lines are indicating that negative forces have yet to fully diminish, while the short-term oscillators are transmitting mixed signals in directional momentum. The MACD, some distance below the zero mark, is flattening towards its red trigger line, while the RSI is static in the bearish region. The stochastic oscillator’s positive charge is fading but it has yet to confirm a credible negative command in the pair.
If the current trajectory endures, strong downside limitations may originate from the key 148.51-149.41 base, which has kept sellers at bay since March 24. In the event this significant barricade gives way, downside moves could snag at the neighbouring 147.39-148.10 support border, which is reinforced by the December 2019 rally peak of 147.95. Diving past this barrier too may spark worries about the broader positive structure. Sellers may then test the 146.40 low ahead of the 144.94 mark – identified around the end of February 2020 – before eyeing the 144.00 handle.
If buyers create traction off the key foundation, upside friction could commence from the red Tenkan-sen line at 150.28 ahead of the 150.80-151.12 resistance band. Next, a push beyond the blue Kijun-sen line at 151.81 and the joined 200- and 100-day SMA at 152.44 could pave the way for a test of the Ichimoku cloud’s lower band at 153.64. From here, should buyers manage to claw their way above the 154.21-154.73 resistance obstacle and the cloud, the 156.00 handle could be up for grabs.
Summarizing, in the bigger picture, GBPJPY remains skewed to the upside if the price holds above the 148.51-149.41 foundation. That said, a drop below the 147.39 trough could trigger downside worries in the pair, while a climb above the 200-day SMA at 152.44 could boost upside impetus.


 Signal2forex.com - Best Forex robots and signals


