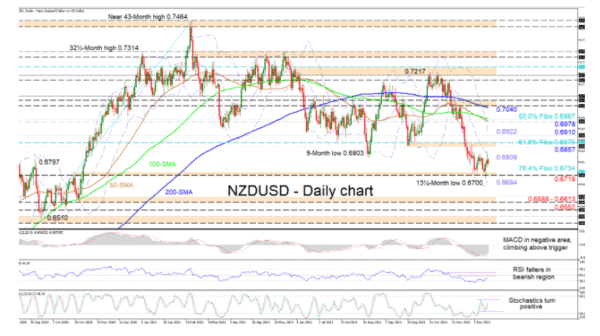
NZDUSD has established a foothold consolidating around the 0.6734 level, which is the 76.4% Fibonacci retracement of the up leg from 0.6510 until 0.7464, after a five-week decline from the 0.7217 high. The simple moving averages (SMAs) are starting to fall, hinting that the neutral-to-bearish tone is securing an advantage.
That said, the short-term oscillators are transmitting mixed signals in directional impetus. The MACD, some distance beneath the zero mark, is indicating that negative momentum is fading as it continues to rise above its red trigger line. The positively charged stochastic oscillator is promoting bullish price action, while the RSI is struggling to push higher in the bearish region.
If buyers re-emerge and overstep the mid-Bollinger band at 0.6808, upside limitations could then commence at the resistance band formed between the 0.6857 barrier and the 61.8% Fibo of 0.6875. Pushing higher, the price may meet the 0.6910 obstacle. From here, if the bulls retain command, the approaching upper Bollinger band at 0.6922 could delay the test of the reinforced resistance zone, moulded between the 0.6978 border and the 50.0% Fibo of 0.6987.
In a negative scenario, sellers may encounter initial support by revisiting the 0.6718-0.6734 boundary. Should selling interest intensify and drive the price past the 13½-month low of 0.6700 as well as the lower Bollinger band, the bears could then dive towards the 0.6588-0.6613 border, developed by the troughs from the beginning of November 2020. Breaching this too, the price may sink towards the 0.6552 mark, increasing worries about the negative picture gaining pace.
Summarizing, NZDUSD is sustaining a negative bearing beneath the 0.6857-0.6875 border. That said, a break below the 0.6487-0.6520 boundary would trigger concerns about the broader positive structure, while a climb above the 0.7100 handle could reinforce the bullish outlook.


 Signal2forex.com - Best Forex robots and signals


