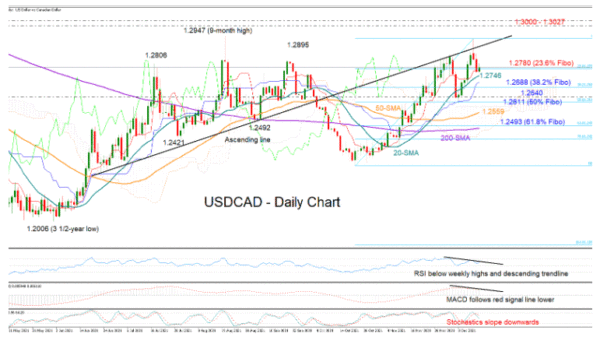
USDCAD attempted to touch its nine-month high of 1.2947 from August earlier this week, but its efforts proved fruitless, with the price drifting lower to find support around the 1.2770 level and the red Tenkan-sen line.
Signals from momentum indicators are currently discouraging. The MACD is losing steam along its red signal line in the positive territory, the Stochastics are sloping southwards, while the RSI is still below its weekly highs despite pushing for some recovery today. Of note, the RSI and the MACD have been moving against the market direction over the start of the month, making lower highs. This reminds of a bearish divergence – a warning that the bulls are running out of fuel.
Nevertheless, if the pair manages to set a strong foothold around the 1.2770 support, the bulls may try to push above the restrictive ascending line at 1.2895 with scope to reach the nine-month high of 1.2947. Breaching that top, the next challenge could occur within the 1.3000 – 1.3027 zone, where the 38.2% Fibonacci retracement of the 2020 freefall (1.4667 – 1.2006) is also placed.
The 23.6% Fibonacci level of the short-term upleg is currently offsetting bullish pressures around 1.2782. Should it stand firm, with the price retreating below the 20-day simple moving average (SMA) at 1.2746, the 38.2% Fibonacci of 1.2688 could next come to the rescue. Failure to rebound here could open the door for the key 1.2640 number and the 50% Fibonacci of 1.2611, while deeper, the 50-day MA may delay any declines towards the 61.8% Fibonacci of 1.2493.
Summarizing, the short-term outlook for USDCAD is looking cloudy at the moment. Unless the price corrects above 1.2895 and the ascending line, sellers could keep the upper hand.


 Signal2forex.com - Best Forex robots and signals


