The US Dollar Index (DXY) was hit heading into the London fix. Although many large trading firms and hedge funds closed shop for the year, there are still some left trading. There are also pension funds that need to mark their books for the end of the year. With the lack of liquidity in the markets, large funds can push price around! The primary reason they are selling today, two days prior to the end of month and year, is that many of these funds mark their books to settlement date. In this case, Wednesday, December 29th is the last trading day as these trades to settle T+2, of Friday, December 31st. By selling US Dollars, EUR/USD and GBP/USD both went bid! What’s next for these pairs?
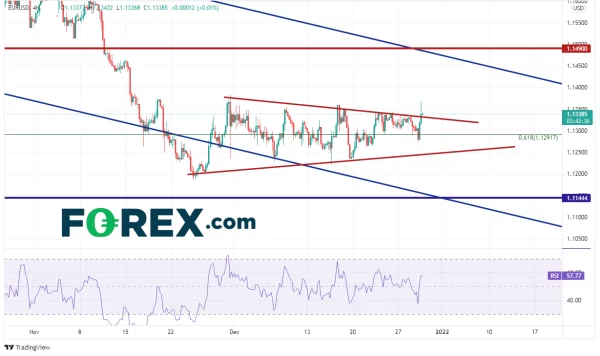
EUR/USD had been moving lower from 1.2215 in an orderly channel since May, however it halted near 1.1186 on November 24th as the pair posted a false breakdown below the bottom trendline of the channel. Since then, EUR/USD has been oscillating around the 61.8% Fibonacci retracement level from the lows of March 2020 to the highs of January 6th near 1.1292.
On a 240-minute timeframe, after breaking out of a short-term consolidation channel, the pair halted just below the 50 Day Moving Average near 1.1391 and pulled back. The next resistance above the 50 Day Moving Average (not shown) is the downward sloping top trendline of the channel and horizontal resistance near 1.1490. EUR/USD is stalling near support at the top trendline of the triangle near 1.1325. If price breaks back below the trendline, support is at the bottom trendline near 1.1240, then the previous lows at 1.1182.
On a 240-minute timeframe, GBP/USD had been moving lower in a descending wedge formation from 1.3600 since November 9th (red line). The pair broke out above the wedge a month later near 1.3225, moved higher into horizontal resistance and pulled back to retest the upper trendline of the wedge. From there, GBP/USD began moving higher on December 20th and hasn’t looked back. The pair moved from 1.3183 up to current levels near 1.3499! 1.3500 is obvious first level of resistance. Earlier in the week, GBP/USD formed a flag formation. The target for the flag is near 1.3570. Price must first break though horizontal resistance at 1.3517 if it is to get there. Above the target, resistance is at early November highs and top of the wedge near 1.3603. Support is back at Wednesday’s lows near 1.3408, then horizontal support near 1.3379. Below there, support is at the top, downward sloping trendline of the wedge near 1.3290.
 Signal2forex.com - Best Forex robots and signals


