It’s not Omicron nor Fed rate hike, but earnings. Bullish investors appeared to have finally gave up after disappointing Netflix report last week. NASDAQ led other major indexes sharply lower, and dragged down cryptocurrencies too. Given that Apple and Tesla will come next, there is risk of even more downside pushes in sentiments.
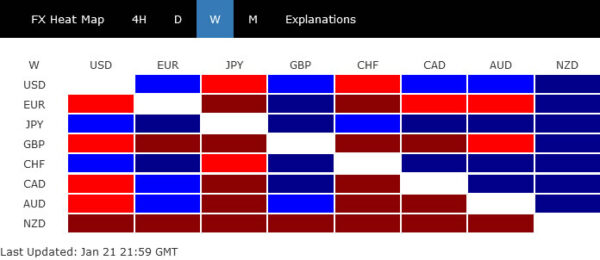
In the currency markets, Yen and Swiss Franc ended as the strongest ones while Dollar was a distant third. New Zealand Dollar was the worst performing, facing additional pressure from selloff against Aussie. Sterling was the second worst followed closely by Euro. Canadian Dollar was actually very resilient, as support from extended rally in oil prices, but starts to look vulnerable too.
NASDAQ in medium term correction, to target 12.5k
The free fall in NASDAQ was a surprise, even more so the strong break of 14100 cluster support level. The break of 55 week EMA on the back of bearish divergence condition in weekly MACD is a rather bearish development. NASDAQ could now be in correction to the whole up trend from 6631.42 (2020 low).
With that in mind, any rebound attempt should be limited by 14860.03 support turned resistance. Fall from 16212.22 should target 38.2% retracement of 6631.42 to 16212.22 at 12552.35 before making a bottom.
S&P 500 in medium term correction too?
S&P 500’s break of trend line support and the move away from 55 day EMA is also rather bearish for S&P 500. The index will now have to defend structural support at 4278.94, which is close to 55 week EMA (now at 4285.89).
Sustained break there will align the outlook with NASDAQ, and indicate that SPX is also in correction to the up trend from 2191.86 (2020 low). In that case, SPX would target 38.2% retracement of 2919.86 to 4818.62 at 3815.19.
DXY recovered ahead of 93.97 fibonacci level
Dollar index extended the recovery from 94.62 and closed above 55 day EMA, indicating some stabilization. There is no change in the view that price actions from 96.93 are merely correcting the up trend from 89.20. That is, in case of another fall, strong support is expected from 38.2% retracement of 89.20 to 96.93 at 93.97 to contain downside.
However, sustained break of 93.97 will argue the trend might have reversed and deeper fall could be seen to 61.8% retracement at 92.15 and possibly below.
NZD/JPY to complete head and shoulder top pattern
In the currency market, NZD/JPY was the top mover last week, losing -1.90%. The development now confirms that rebound from 75.95 has completed at 79.22. More importantly, fall from 82.49 is ready to resume. Immediate focus is on 75.95 support.
Sustained break of 75.59 will also complete a head and should top pattern (ls: 80.17, h: 82.49, rs: 79.22). In this case, NZD/JPY should fall through 74.54 support to 100% projection of 82.49 to 75.95 from 79.22 at 72.68. Reaction from there will decide when such decline is a correction to the up trend from 59.49. Or, it’s already reversing the trend.
GBP/CHF to extend the correction from 1.3070 with another leg.
GBP/CHF was also one of the bigger movers, losing -1.12%. The development suggests that rise from 1.2134 has completed at 1.2606 already, after rejection by medium term falling trendline. The pattern from 1.3070 is probably now in its fifth leg. Further decline should be seen through 1.2134 low.
Larger outlook is not too bearish though, as the structure of the fall from 1.3070 is still corrective looking. It’s more likely a correction to the up trend from 1.1107 then not. Nevertheless, GBP/CHF could try to reach 61.8% projection of 1.1107 to 1.3070 at 1.1857 before forming a bottom.
Bitcoin extends down trend, to bottom above 29261
Bitcoin’s down trend resumed last week but powering through 40k handle, and hit as low as 35102. 61.8% projection of 68986 to 41908 from 52101 at 35366. was already met, but there is not clear sign of bottoming yet. Overall, decline from 68986 is still viewed as as part of a long term range pattern between 29261 and 68986 only. Hence, momentum to start to diminish below 35366, and a bottom should be formed above 29261 low.
Nevertheless, break of 41908 support turned resistance is needed to be the first sign of bottoming, or risk will stay heavily on the downside even in case of recovery. In an unlikely more bearish scenario, bitcoin could extend the down trend to 100% projection at 25023 if it couldn’t defend 30k handle.
USD/CAD Weekly Outlook
USD/CAD’s late rebound and break of 1.2569 minor resistance last week suggests short term bottoming at 1.2448, after touching trend line support. Initial bias is back on the upside for 1.2619 support turned resistance first. Firm break there will argue that whole pull back from 1.2963 has completed and bring stronger rally through 1.2812 to retest 1.2964. Nevertheless, rejection by 1.2619, followed by break of 1.2448, will retain near term bearishness for deeper decline to 1.2286 support next.
In the bigger picture, focus stays on 38.2% retracement of 1.4667 (2020 high) to 1.2005 (2021 low) at 1.3022. Sustained break there should confirm that the down trend from 1.4667 has completed after defending 1.2061 long term cluster support. Further rise would then be seen towards 61.8% retracement at 1.3650. However, rejection by 1.3022 will maintain medium term bearishness. Break of 1.2005 will resume the down trend form 1.4667 and that carries larger bearish implications too.
In the longer term picture, we’re viewing price actions from 1.4689 as a consolidation pattern. Thus, up trend from 0.9506 (2007 low) is still expected to resume at a later stage. This will remain the favored case as long as 1.2061 support holds, which is close to 50% retracement of 0.9406 to 1.4689 at 1.2048. However, firm break of 1.2061 support will argue that USD/CAD has already started a long term down trend. Next target is 61.8% retracement of 0.9406 to 1.4689 at 1.1424.
 Signal2forex.com - Best Forex robots and signals


