US Non-Farm Payrolls showed that economy added 428,000 jobs in April, matching March’s revised print and beating average estimates of 391,000. In addition, the report showed that the Unemployment rate was unchanged at 3.6% vs expectations of a drop to 3.5%. Average hourly earnings were 0.3% vs a revised print of 0.5% in March and estimates of 0.4%. When all is said and done, the headline print was a solid beat vs expectations. The Fed noted at its FOMC meeting earlier this week that labor markets were extremely tight and that it was essential for the Fed to bring down inflation to keep a strong labor market. Today’s NFP data helps to confirm this view on employment.
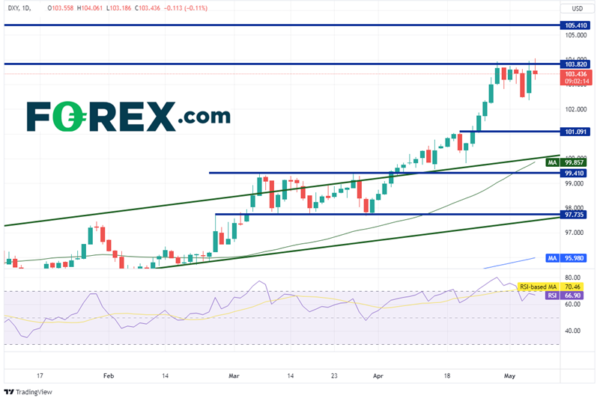
The US Dollar Index had been moving higher since May 2021 in an orderly channel. In early April, the DXY broke above the top trendline as the channel near 99.30 as price began to move in a parabolic formation. Price reached a 20 year high on April 28th at 103.93. Today, the DXY traded briefly above that level to its highest level since December 2002 at 104.06. Notice that the RSI was in overbought territory and the recent consolidation has allowed it to move back to neutral levels.
Source: Tradingview, Stone X
On a 240-minute timeframe, the DXY is still trading near today’s highs. Resistance levels above are at the 1.272% Fibonacci extension from the high of April 28th to the low of May 5th at 1.0435, then the 161.8% Fibonacci extension from the same timeframe near 1.0490. Above there, price can trade to horizontal resistance from September 2002 at 1.0541. (see daily). If price pulls back, the first support level is the May 5th lows at 1.0235. Below there, price can fall to horizontal support levels at 101.86 and 101.03.
Source: Tradingview, Stone X
EUR/USD tends to move similarly, but opposite, to the DXY as the Euro makes up over 57% of the US Dollar Index composition. If the DXY does move higher, EUR/USD could move lower. First support is the low of April 28th at 1.0471. Below there, price can fall to the 127.2% Fibonacci extension from the lows of April 28th to the highs of May 22nd at 1.0424 and then the 161.8% Fibonacci extension from the same timeframe at 1.0365. If EUR/USD bounces, first resistance is at the May 22nd highs at 1.0642, then horizontal resistance at 1.0696 and 1.0761.
Tradingview, Stone X
Today’s Non-Farm Payroll data confirms what the Fed said in its statement: that labor conditions are tight. In addition, Average Hourly Earnings were in-line with estimates. If the Fed continues to raise rates, will either of these jobs numbers begin to move lower? That will be at the forefront of the Fed’s mind over the next month ahead of June’s NFP print.
 Signal2forex.com - Best Forex robots and signals


