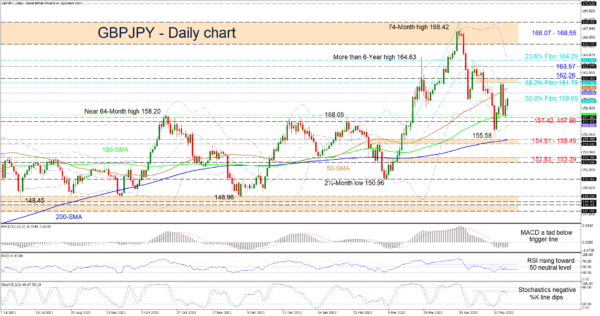
GBPJPY is confronting the 159.69 barrier, which is the 50.0% Fibonacci retracement level of the uptrend from 150.96 until the multi-year high of 168.42, which failed to close north of the 166.07-168.55 resistance zone that extends back to February 2016. The climbing simple moving averages (SMAs) are endorsing the broader bullish structure but it’s worth mentioning that the positive rebounds in the price over the latest one-month decline continue to be capped by the Fibonacci levels.
The short-term oscillators are transmitting conflicting messages in directional momentum. The MACD, which is creeping higher in the negative region, is nearing the red trigger line, suggesting downside momentum is softening, while the rising RSI is flirting with the 50 level. Meanwhile, the negatively charged stochastic oscillator is promoting bearish price action in the pair.
Currently, buyers are battling the 50.0% Fibo of 159.69 to boost positive developments. Successfully moving higher, resistance could then commence around the mid-Bollinger band at 160.63 and the 50-day SMA at 161.20. If positive forces endure, the next upside limitations may emanate from the resistance band between the 38.2% Fibo of 161.76 and the 162.26 barrier. Recapturing the area north of this barricade could reinforce upside pressures where buyers face the 163.57 high and the 23.6% Fibo of 164.29, where the upper Bollinger band presently resides.
Otherwise, if the price fades back beneath the 50.0% Fibo of 159.69, congested support may transpire from the 100-day SMA at 158.15 and the adjacent lows of 157.86 and 157.42 respectively. A deeper dive in the price below the lower Bollinger band at 156.98 could encourage sellers to target the fortified 154.91-155.45 support border. If selling interest persists, the next support obstacle may arise around 152.83-153.39.
Summarizing, GBPJPY is sustaining a one-month bearish bearing beneath the 161.76-162.26 resistance boundary. Yet, the bulls are making efforts to shift the outlook to the upside.


 Signal2forex.com - Best Forex robots and signals


