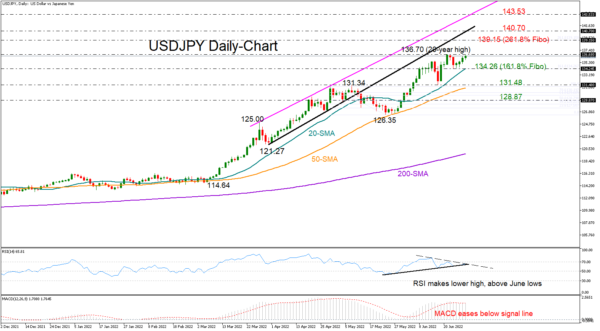
USDJPY managed to gain fresh buying traction around the resistance-turned-support area of 134.42 last week, with the price currently looking to extend its broad uptrend above the 20-year high of 136.70.
Although the clear positive slope in the simple moving averages (SMAs) is still backing the bullish direction in the market, the momentum indicators warrant some caution over the strength in the market. The RSI, although above its June lows, has marked a new lower high after peaking in an overbought area. Similarly, the MACD is gradually losing momentum below its red signal line despite remaining elevated in the positive area.
Should the bulls snap the top of 136.70, the next obstacle could be the 261.8% Fibonacci extension of the 131.34 – 126.35 downleg at 139.15, while the broken support line could immediately cap the rally near 140.70, preventing a spike towards the tentative resistance line seen around 143.53.
On the downside, the 20-day SMA and the 134.26 base, which is also the 161.8% Fibonacci extension, may buffer a potential negative reversal. If not, the decline could sharpen towards the 131.48 low, where the 50-day SMA is currently converging. Failure to bounce here may produce another important bearish correction towards the 128.87 constraining zone.
All in all, although USDJPY is trading in bullish territory, technical signals reflect some weakness in buying appetite. Traders could wisely wait for a durable move above 135.45 before becoming more confident on the latest upturn.


 Signal2forex.com - Best Forex robots and signals


