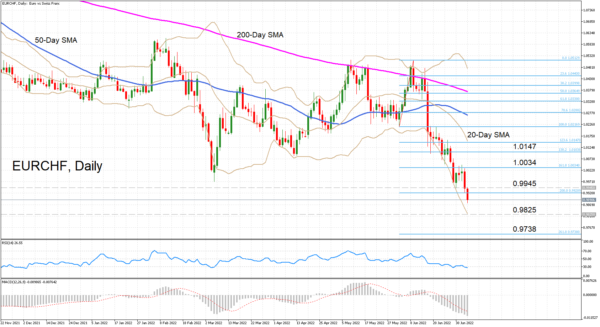
EURCHF tumbled to a fresh seven-and-a-half year low of 0.9875 on Wednesday, extending the sharp selloff that began on June 9. The momentum indicators are deep in negative territory so further losses are likely in the near term. However, there are some signs that the downside pressure may be easing, albeit very slightly.
The RSI has dipped below 30 into the oversold region, but its downward slope is getting shallower. The MACD also continues to deteriorate, with the histogram holding well below the red signal line.
But perhaps of more importance is the fact that despite the latest slide, the price has not yet reached the lower Bollinger band, indicating that there is scope for further losses in the immediate term.
Should the pair decline towards the lower Bollinger band, which currently stands near the 0.9825 mark, and is able to smash below it, the next support may not emerge until the 261.8% Fibonacci extension of the early June upleg at 0.9738. Breaking below this barrier too would shift attention to the 0.95 level.
However, if EURCHF is able to bounce off the lower Bollinger band like it has been doing since mid-June, the rebound could initially stumble at 0.9945 before the bulls aim for the 161.8% Fibonacci extension of 1.0034. A successful climb above this level could strengthen the positive momentum and stretch the gains towards the 20-day moving average (MA), which is about to intersect the 123.6% Fibonacci of 1.0147.
To sum up, the short-term bias remains very bearish and only a recovery towards the 20-day MA would significantly diminish the selling pressure. However, in the medium term, the price needs to reclaim the 50-day MA to restore the neutral outlook.


 Signal2forex.com - Best Forex robots and signals


