As WTI’s price plunged below $100 a barrel on the 5th of July, it raised eyebrows across the markets, as analysts are pushed to the edge of their seats, pondering on what’s to follow. Without a doubt, recession fears and slowing demand helped bring down oil at levels once seen before during May 2022, however the question is raised to whether those were indeed the catalysts responsible for the turnaround from soaring prices in recent months. In this report we aim to shed light on the current developments of oil and present various opinions alongside a technical analysis at the end.
As post pandemic lockdown restrictions were lifted earlier this year, the strong demand for oil consumption collided with the persistent supply shortages, as the world turned to normalization. Fueling the fire, the disrupted energy supply lines from the Russian invasion in Ukraine, were an additional blow to the supply side, that urged the European continent to scramble for alternative solutions. As a result, we are seeing an upshot of ever-increasing inflationary pressures worldwide and central banks tighten their monetary policies by aggressively hiking interest rates, in an attempt to contain surging prices, to slow down economic growth and cool down their economies. Nonetheless, as oil supply remains scarce and since demand significantly outweighs it at the moment, the problem persists.
The address by US President Biden towards refiners in late June, accusing them of heavy price gauging at the expense of consumers and urging them to expand capacity, may have impacted oil prices recently, accelerating the downfall. Refiners are indeed, logging impressive profits lately as the S&P Energy sector is currently the only one in positive territory year-to-date. According also to U.S. Energy Information Administration “refiners have been running at almost 94% of operable capacity, close to the 96.6% peak reached in the past decade”. Moreover, in the recent OPEC meeting at the start of July, it was agreed to stick to a planned output increase in August. They decided to raise the output by 648,000 barrels per day for both months July and August, a decision hailed by President Biden’s administration which has repeatedly pushed for the group to pump more. Those targets if met, will set an end to the historic output cuts, implemented during the pandemic.
The unexpected death of Mohammad Barkindo, the OPEC Secretary General, announced on Wednesday the 6th of July, leaves the oil cartel without a head, during ambiguous times for the markets and could spark increased uncertainty in the grander scheme of this for the energy market.
Turning towards WTI price action, the drop below the psychological $100 a barrel level on the 5th of July may ignite short term speculative trading, not necessarily reflecting fundamentals, but instead grabbing the attention of technical analysts, traders and algos, rushing to jump onto the opportunity.
Looking ahead, oil prices flirt with a third consecutive weekly decline. On the other hand, according to some analysts, oil price may face a larger correction higher, should OPEC in the next meeting on the 3rd of August, fail to meet the agreed upon output projections. Also worth looking at the is release of US Baker Hughes report tomorrow 8th of July, reporting the active drilling rigs in the US and consequently hinting towards the increase or decrease in demand for oil.
Technical Analysis
WTI H4
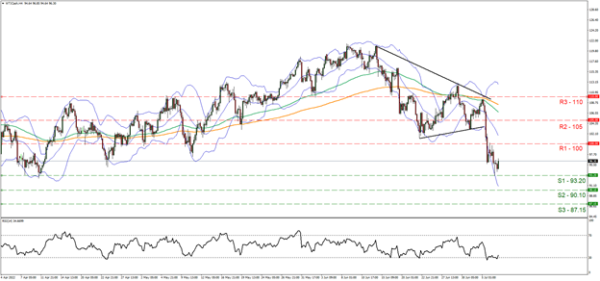
Looking at the WTI H4 chart we observe the downward trend was initiated on the 16th of June, where it dropped from the $121 level, broke below the $100 psychological level on the 5th of July and found support at the $93.20 (S1) level during yesterday’s session, the 6th of July, a level once saw before back in April 2022. In our view WTI appears overextended, having excessive selling pressure, causing the sharp decline from the $110 range to the where it is currently found, the $96 range. Thus, we believe a rebound towards the $100 level could be a possibility in the short-term horizon, followed by consolidation. Supporting our view in regard to the overextended scenario, is the RSI indicator shown below the 4-hour chart, with a reading of 26 crossing below the 30 oversold level. Should the bears continue to reign over, we may see the break of $93.20 support (S1) line and the $90.10 (S2) line as well. Should the bulls take over, we could expect a break above the $100 psychological hurdle, now serving as resistance (R1) line and move decisively towards the $105 resistance (R2) level.


 Signal2forex.com - Best Forex robots and signals


