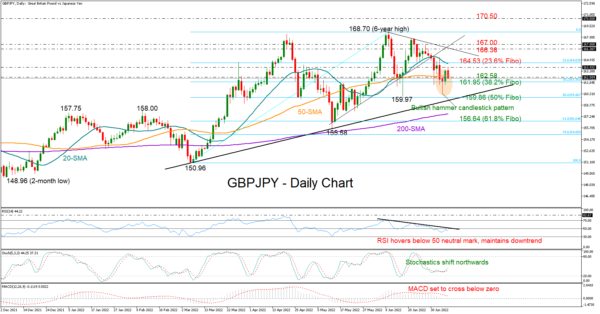
GBPJPY finished Thursday’s session comfortably in the green zone after refusing to close below the 162.00 round level once again. Simultaneously, the bullish action seems to have confirmed Wednesday’s hammer candlestick pattern – an encouraging sign that the balance may change in the favor of the bulls, potentially causing an upside reversal in the price.
Consulting other technical indicators, however, some patience might still be required. Despite the soft upturn in the Stochastics, the RSI is still consolidating its downtrend below its 50 neutral mark. The MACD is also lacking bullish signs, testing a cross below its zero line instead.
The 50-day simple moving average (SMA), where the 20-period SMA is also positioned in the four-hour chart, is currently buffering bearish forces around 162.58. If the price secures a floor around that level, it may rotate towards the 20-day SMA at 164.53 once today’s ceiling of 163.93 (200-period SMA in the four-hour chart) gives way. The 23.6% Fibonacci retracement of the 150.96 – 168.70 upleg is in the neighborhood as well. Hence, any additional gains from here are expected to drive the pair straight up to the tentative short-term falling trendline seen at 166.38, while a close above the 167.00 number could be a prerequisite to visit the topline at 168.70.
On the downside, traders will keep a close eye on the 162.58 – 161.95 support zone, which encapsulates the 38.2% Fibonacci too. If that base collapses, the bears may again attempt to reach the 50% Fibonacci of 159.86 and the tentative ascending trendline from the low of 150.96. Another failure here could see the price initially seeking shelter around the 200-day SMA and then near the 61.8% Fibonacci of 156.64.
In brief, GBPJPY is still exposed to sellers’ dominance despite the latest positive candlestick formation. A decisive move above the 163.93 – 164.53 area could raise confidence in the latest price upturn, while a break below 162.58 – 161.95 is expected to worsen market sentiment.


 Signal2forex.com - Best Forex robots and signals


