What will happen?
This week several important macroeconomic reports will be presented. On Wednesday, the Bureau of Labor Statistics will publish the consumer price index (CPI), which accounts for most of the overall inflation. Moreover, on Thursday, the markets will get the numbers for the US producer price index (PPI), a leading indicator of consumer inflation.
Why these two reports are might be more important this week than usual? Let’s discuss.
Expectations
Last month, US consumers finally found some relief at gas pumps as fuel prices fell. Therefore, analysts expect that inflation growth will slow down in July. According to their forecasts, the consumer price index will increase by 0.2% in July from a month earlier, which would be the smallest advance since the start of 2021. However, the so-called core measure, which excludes energy and food, might climb by 0.5%.
Despite a predicted inflation growth slowdown, inflation pressure remains intense. Moreover, the July payroll report added fuel to the fire. Firstly, it included a larger-than-forecast pickup in hourly earnings, i.e. the evidence that inflation keeps rising. Second, the unemployment rate declined and nonfarm payrolls (NFP) came at 528K which means that the US economy gained more jobs than expected in July and that recession fears could be exaggerated. These two things may lead the Federal Reserve policymakers to significantly increase the key rate at the September meeting.
How to trade on the invent?
Higher-than-expected CPI and PPI numbers might significantly boost the US dollar, sending risk assets down due to investors’ fear about one more 75-basis-point rate hike, which might occur as the Federal Reserve still has room thanks to the strong labor market.
On the other hand, if the actual result meets or underperforms the expectations, it would mean that the Federal Reserve finally succeeded in the battle against inflation, and the era of cheap money is not far away. In this case, investors will rush to the stock and crypto markets. NASDAQ (US100) will win the most among all stock indices.
What to watch?
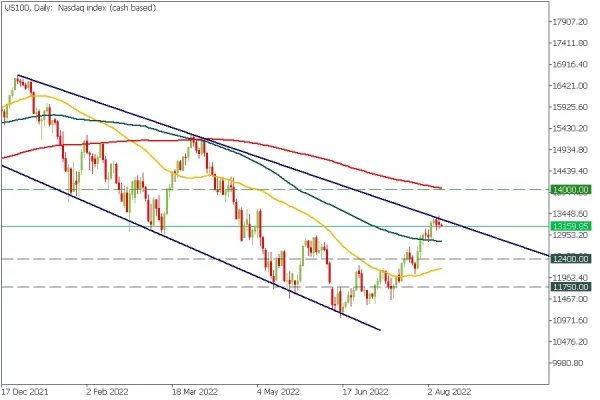
US100, daily chart
US100 is trading under the descending trend line on the daily timeframe. The breakout of this trendline might open the way even to 2021 high. However, before that, the price should exceed the 200-day moving average.
On the other hand, higher-than-expected CPI numbers will send the index down to 12 400 and possibly even to 11 750.
XAUUSD, daily
Gold is another asset to fly if the actual data meets or underperforms expectations.
The price broke through the descending trendline on the daily timeframe, and buyers already closed two daily candles above the 50-day moving average. In the case of a bull run, the targets are 1808 and 1830.
On the other hand, higher than expected numbers will send gold to the breakout retest at 1772 and 1760.
USDCAD, daily
USDCAD is the currency pair with the most precise setup ahead of the volatile week.
The pair has broken through the ascending trendline, signaling an upcoming bearish trend.
Lower-than-expected CPI data might press the pair to 1.2784, while better-than-expected results will push the price to 1.2885 and even 1.2945 if the price breaks the trendline backward.


 Signal2forex.com - Best Forex robots and signals


