

📑 Table of Contents
- 1. What Are Candlestick Patterns?
- 2. How to Read Candlestick Charts
- 3. Bullish vs Bearish Patterns — What’s the Difference?
- 4. Top 10 Candlestick Patterns — Complete Guide
- 5. Candlestick Pattern Quick Reference
- 6. How Reliable Are Candlestick Patterns?
- 7. How to Trade Candlestick Patterns — Step by Step
- 8. Common Mistakes When Trading Candlesticks
- 9. Frequently Asked Questions
1. What Are Candlestick Patterns?
Candlestick patterns are formations created by one or more candlesticks on a price chart. They help traders predict future price movements based on historical patterns. Common patterns include Doji, Hammer, Engulfing, and Harami.
Developed in Japan over 300 years ago by rice traders, candlestick charting has become one of the most popular methods of technical analysis in modern trading. Each candlestick represents price action over a specific time period and shows the open, high, low, and close prices.
2. How to Read Candlestick Charts
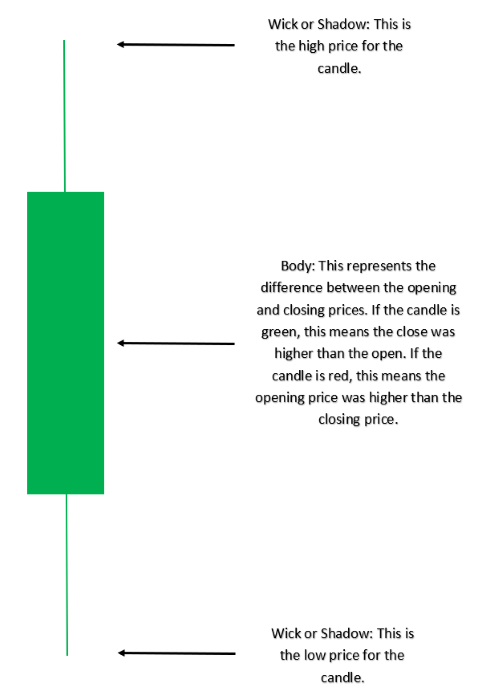
Before diving into specific patterns, it is essential to understand how to read a candlestick chart. Each candlestick provides four key pieces of information:
- Open: The price at which the period began.
- High: The highest price reached during the period.
- Low: The lowest price reached during the period.
- Close: The price at which the period ended.
The body of the candlestick represents the range between the open and close. A bullish (green/white) candle closes higher than it opened, while a bearish (red/black) candle closes lower than it opened. The wicks (or shadows) represent the high and low prices.
3. Bullish vs Bearish Patterns — What’s the Difference?
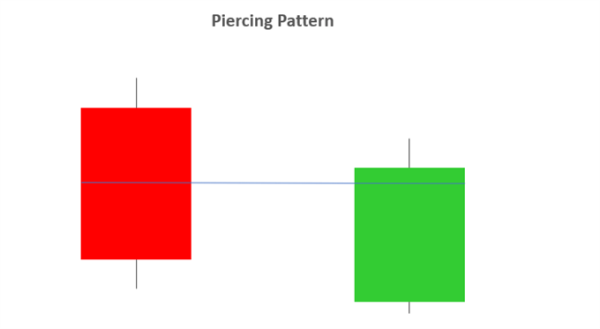
Bullish patterns signal a potential reversal to the upside. They typically form at the bottom of a downtrend and indicate that buyers are gaining control. Common bullish patterns include Hammer, Bullish Engulfing, Bullish Harami, Morning Star, and Piercing Pattern.
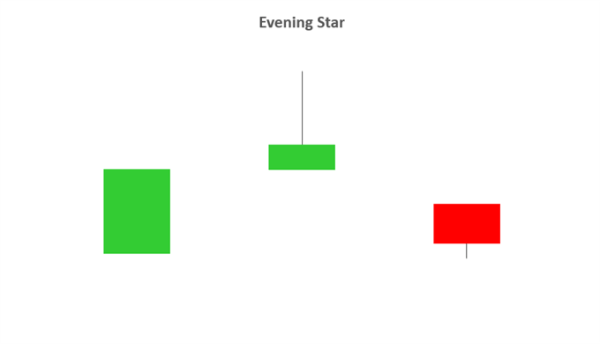
Bearish patterns signal a potential reversal to the downside. They typically form at the top of an uptrend and indicate that sellers are gaining control. Common bearish patterns include Shooting Star, Bearish Engulfing, Bearish Harami, Evening Star, and Dark Cloud Cover.
💡 Trading tip: Always consider the context — a pattern that forms after a prolonged trend is more reliable than one that forms in a sideways market.
4. Top 10 Candlestick Patterns — Complete Guide
Below are the top 10 candlestick patterns every trader must know. Each pattern is explained with its characteristics, signal, and how to trade it.
| Pattern | Type | Signal | Reliability | Best Timeframe |
|---|---|---|---|---|
| Doji | Neutral | Indecision | ~50% | Any |
| Hammer | Bullish | Reversal | ~60-70% | Daily, 4H |
| Shooting Star | Bearish | Reversal | ~60-70% | Daily, 4H |
| Bullish Engulfing | Bullish | Strong Reversal | ~60-75% | Daily, 4H |
| Bearish Engulfing | Bearish | Strong Reversal | ~60-75% | Daily, 4H |
| Bullish Harami | Bullish | Subtle Reversal | ~50-65% | Daily, 4H |
| Bearish Harami | Bearish | Subtle Reversal | ~50-65% | Daily, 4H |
| Morning Star | Bullish | Reversal | ~60-70% | Daily, Weekly |
| Evening Star | Bearish | Reversal | ~60-70% | Daily, Weekly |
| Dark Cloud Cover | Bearish | Reversal | ~55-65% | Daily, 4H |
📌 Reliability is based on historical performance when confirmed with additional indicators. Higher timeframes (daily, weekly) tend to be more reliable.
1. Doji — The Indecision Pattern
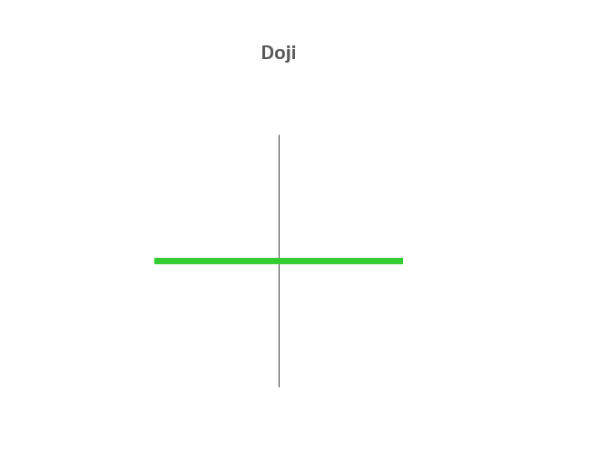
A Doji is a candlestick pattern with a very small body, indicating indecision in the market. It can signal a potential reversal or consolidation, depending on where it appears in a trend.
2. Hammer — The Bullish Reversal
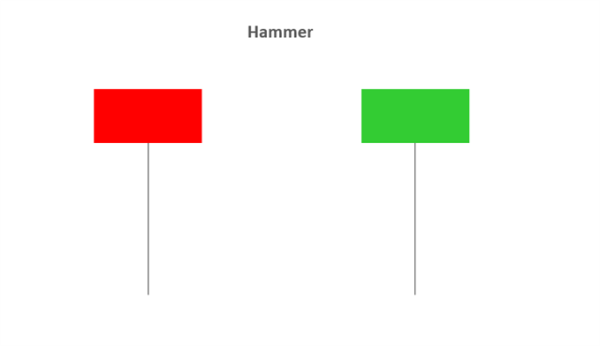
A Hammer forms at the bottom of a downtrend and signals a bullish reversal. It has a small body and a long lower wick, indicating that sellers pushed the price down but buyers brought it back up.
3. Shooting Star — The Bearish Reversal
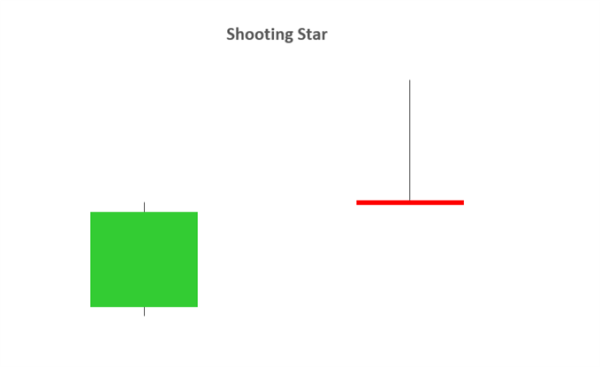
A Shooting Star forms at the top of an uptrend and signals a bearish reversal. It has a small body and a long upper wick, indicating that buyers pushed the price up but sellers brought it back down.
4. Bullish Engulfing — The Strong Reversal
A Bullish Engulfing pattern forms at the bottom of a downtrend. The first candle is bearish (red), and the second candle is bullish (green) and completely engulfs the first candle’s body, signaling a strong reversal to the upside.
5. Bearish Engulfing — The Strong Reversal
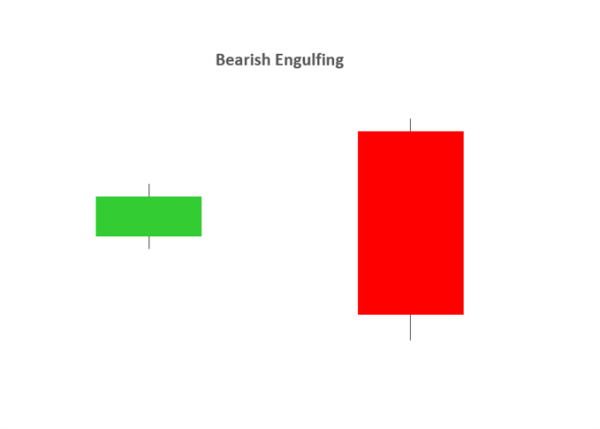
A Bearish Engulfing pattern forms at the top of an uptrend. The first candle is bullish (green), and the second candle is bearish (red) and completely engulfs the first candle’s body, signaling a strong reversal to the downside.
6. Bullish Harami — The Subtle Reversal
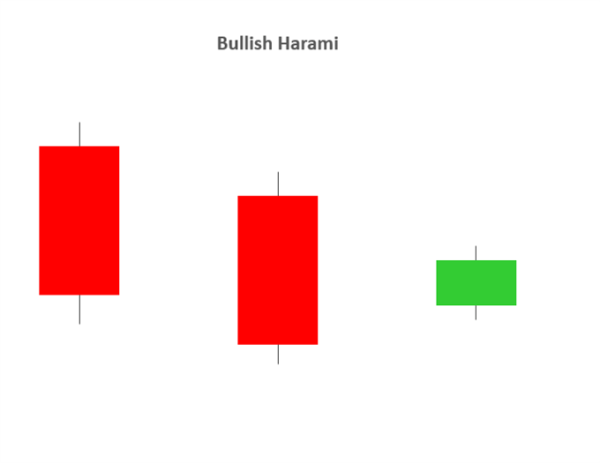
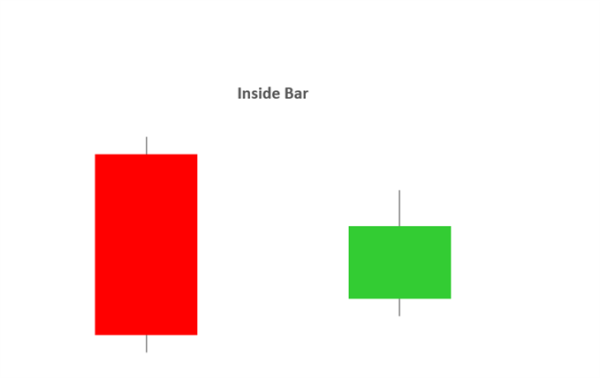
A Bullish Harami is a subtle bullish reversal pattern. It consists of a large bearish candle followed by a smaller bullish candle that is completely contained within the first candle’s body.
7. Bearish Harami — The Subtle Reversal
A Bearish Harami is a subtle bearish reversal pattern. It consists of a large bullish candle followed by a smaller bearish candle that is completely contained within the first candle’s body.

8. Morning Star — The Bullish Reversal
A Morning Star is a bullish reversal pattern that forms at the bottom of a downtrend. It consists of three candles: a long bearish candle, a small-bodied candle (Doji or spinning top), and a long bullish candle.
9. Evening Star — The Bearish Reversal
An Evening Star is a bearish reversal pattern that forms at the top of an uptrend. It consists of three candles: a long bullish candle, a small-bodied candle (Doji or spinning top), and a long bearish candle.
10. Dark Cloud Cover — The Bearish Reversal
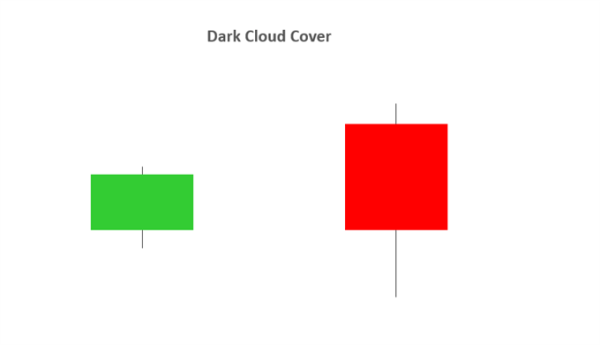
A Dark Cloud Cover is a bearish reversal pattern that forms at the top of an uptrend. It consists of a long bullish candle followed by a bearish candle that opens above the first candle’s close but closes below the midpoint of the first candle’s body.
5. Candlestick Pattern Quick Reference
This static reference table categorises patterns by type for quick identification.
| Bullish Patterns | Bearish Patterns |
|---|---|
| Hammer | Shooting Star |
| Bullish Engulfing | Bearish Engulfing |
| Bullish Harami | Bearish Harami |
| Morning Star | Evening Star |
| Piercing Pattern | Dark Cloud Cover |
📌 Bullish Patterns signal potential upward reversals. Bearish Patterns signal potential downward reversals. Always confirm with additional indicators.
6. How Reliable Are Candlestick Patterns?
The reliability of candlestick patterns depends significantly on the timeframe, market context, and confirmation signals. Here are the key statistics:
- Engulfing Patterns: 60-75% success rate when confirmed with volume and other indicators.
- Hammer/Shooting Star: 60-70% success rate on daily and higher timeframes.
- Harami Patterns: 50-65% success rate — more subtle and requires stronger confirmation.
- Morning/Evening Star: 60-70% success rate on daily and weekly charts.
- Dark Cloud Cover: 55-65% success rate, more reliable when confirmed by RSI or MACD.
💡 Trading tip: Higher timeframes (daily, weekly) tend to be more reliable than lower timeframes (1-minute, 5-minute). Always use multiple timeframes and confirmation signals for the best results.
7. How to Trade Candlestick Patterns — Step by Step
Trading candlestick patterns requires a disciplined approach. Follow these five steps to maximise your chances of success.
Step 1 — Identify the Pattern
- Ensure the pattern is in the correct market context (downtrend for bullish patterns, uptrend for bearish patterns).
- Confirm the candlestick formation matches the pattern’s characteristics.
Step 2 — Wait for Confirmation
- Wait for the next candle to close in the direction of the pattern signal.
- Look for additional confirmation from RSI, MACD, or support/resistance levels.
Step 3 — Entry Rules
- Bullish Pattern: Enter a long position on a break above the pattern’s high or the next candle’s high.
- Bearish Pattern: Enter a short position on a break below the pattern’s low or the next candle’s low.
Step 4 — Stop-Loss Placement
- Bullish Pattern: Place stop-loss below the pattern’s low.
- Bearish Pattern: Place stop-loss above the pattern’s high.
- Risk Management: Never risk more than 1–2% of your trading account on a single trade.
Step 5 — Take-Profit Targets
- Bullish Pattern: Target the previous swing high or use Fibonacci extensions.
- Bearish Pattern: Target the previous swing low or use Fibonacci extensions.
- Risk-Reward: Aim for a minimum risk-reward ratio of 1:2.
8. Common Mistakes When Trading Candlesticks
Avoid these common pitfalls to improve your success rate with candlestick patterns.
- ❌ Trading the pattern in isolation: Candlestick patterns require confirmation from other indicators like RSI, MACD, or support/resistance levels.
- ❌ Ignoring the overall trend: Patterns are most reliable when they form after a prolonged trend (downtrend for bullish, uptrend for bearish).
- ❌ Entering too early: Entering before the pattern is confirmed can lead to false signals.
- ❌ Placing stop-loss too tight: Setting the stop-loss too close to the entry can result in being stopped out by normal market noise.
- ❌ Ignoring volume: Low volume on the pattern candle reduces the reliability of the signal.
- ❌ Using lower timeframes: Patterns on 1-minute or 5-minute charts are less reliable than those on daily or 4-hour charts.
9. Frequently Asked Questions
What are candlestick patterns in trading?
Candlestick patterns are formations created by one or more candlesticks on a price chart. They help traders predict future price movements based on historical patterns. Common patterns include Doji, Hammer, Engulfing, and Harami.
What is the most reliable candlestick pattern?
The engulfing pattern (both bullish and bearish) is considered one of the most reliable, with a success rate of approximately 60-75% when confirmed with other indicators. The hammer and shooting star also have strong reliability at 60-70%.
What is a bullish candlestick pattern?
A bullish candlestick pattern signals a potential reversal to the upside. Common bullish patterns include Hammer, Bullish Engulfing, Bullish Harami, Morning Star, and Piercing Pattern.
What is a bearish candlestick pattern?
A bearish candlestick pattern signals a potential reversal to the downside. Common bearish patterns include Shooting Star, Bearish Engulfing, Bearish Harami, Evening Star, and Dark Cloud Cover.
What is a Doji candlestick pattern?
A Doji is a candlestick pattern with a very small body, indicating indecision in the market. It can signal a potential reversal or consolidation, depending on where it appears in a trend.
What is the difference between a Hammer and a Shooting Star?
A Hammer forms at the bottom of a downtrend and signals a bullish reversal. A Shooting Star forms at the top of an uptrend and signals a bearish reversal. Both have small bodies and long wicks, but in opposite directions.
What is an engulfing pattern?
An engulfing pattern is a two-candle reversal pattern where the second candle completely engulfs the body of the first candle. A bullish engulfing forms in a downtrend, while a bearish engulfing forms in an uptrend.
How accurate are candlestick patterns?
Candlestick patterns typically have a success rate of 50-80% depending on the pattern, timeframe, and confirmation signals. Higher timeframes (daily, weekly) tend to be more reliable than lower timeframes.
What is the best candlestick pattern for beginners?
The Hammer and Shooting Star are excellent patterns for beginners due to their simplicity and clear visual identification. The Doji is also a good starting point for understanding market indecision.
📊 Master another powerful pattern: Learn how to trade the bearish harami pattern — a complete trading guide. Understanding individual patterns in depth gives you a complete technical analysis toolkit and improves your ability to spot high-probability setups.
📈 Enhance your trading with the right tools: Explore our collection of forex indicators for download — powerful tools that can help you identify patterns, confirm signals, and manage your trades with confidence.
📞 Need help with your candlestick trading strategy? Our team is here to assist you. Visit our Contact Page or use the online chat available on every page of our website for immediate support.



 Signal2forex.com - Best Forex robots and signals


