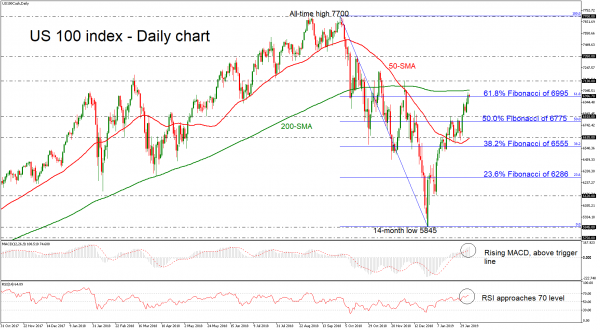
The US 100 index (NASDAQ 100) has been in a positive tendency after the jump above the 61.8% Fibonacci retracement level of the downleg from the all-time high of 7700 to the 14-month low of 5845, around 6995. Currently, the price remains below the 200-day simple moving average (SMA), which is acting as a strong resistance level for the bulls.
Momentum indicators in the daily chart, though, are currently supporting that positive momentum is likely to strengthen in the short-term. Specifically, the RSI is holding above 50 and the MACD continues to distance itself above its red signal line.
Should the price decisively close above the roof of 200-SMA, traders could extend the bullish movement towards the 7130 resistance barrier. Further advances above this level, could then target the area around the 7350 hurdle.
On the other side, a decline could meet the 6818 – 6775 support area, near the 50.0% Fibonacci region, before moving even lower towards the next significant obstacle of 6635, which stands around the 50-day SMA.
The recent bullish action turned the very short-term picture more positive, however, in the bigger view the index entered neutral mode.
For traders: our Portfolio of forex robots for automated trading has low risk and stable profit. You can try to test results of our forex ea download
Signal2forex reviews
 Signal2forex.com - Best Forex robots and signals


