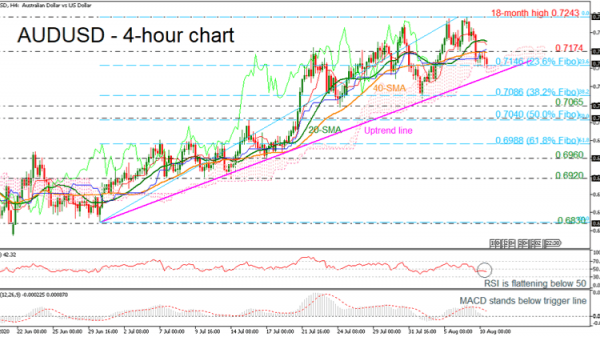
AUDUSD completed a double top formation around the 0.7243 resistance level and dropped beneath the 0.7174 resistance and the 40-period simple moving average (SMA). However, the price found strong support at the 23.6% Fibonacci retracement level of the up leg from 0.6830 to 0.7243 at 0.7146 and the Ichimoku cloud.
Technically, the RSI indicator is flattening below the 50 level and the MACD oscillator dropped beneath the trigger line and the zero level. The 20- and 40-period SMAs are sloping marginally down suggesting a possible downside pullback.
A move below the ascending trend line could increase downside speculation, testing the 38.2% Fibonacci of 0.7086 and the 0.7065 support. More losses could send the market until the 0.7065 support and the 50.0% Fibonacci of 0.7040.
On the other side, a successful climb above the 0.7174 resistance and the 20-period SMA could hit the 18-month peak of 0.7243. Above that, the market could make a pause near the 0.7295 hurdle, taken from the peak on January 2019.
Overall, AUDUSD has been developing in an upward movement since June 30 and only a decisive decline beneath the rising trend line may change the outlook to neutral.
 Signal2forex.com - Best Forex robots and signals


