The British Pound is looking quite confident against the USD despite the Brexit complications and the fact that there is too little time left for negotiating the trade agreement. Of course, there is some progress but the question is whether a couple of days will be enough for the policymakers to agree on the deal that they have been discussing for almost a year.
Some days ago, one of the EU representatives said that the parties were very close to approve the key matters of the agreement. However, the three major arguable points are still up in the air: borders issue, trade relations, and fishing aspects. Even after one of the negotiators turned out to be tested positive for the Covid-19, the United Kingdom and the European Union didn’t stop the talks – they continued online.
The agreement has to come into force in 6 weeks, 4 of which will be spent on the ratification of everything that will have approved by the policymakers by that time. In the case of no agreement, there will be a so-called “worst-case scenario” Brexit, which will put extremely high long-term pressure on the national currency.
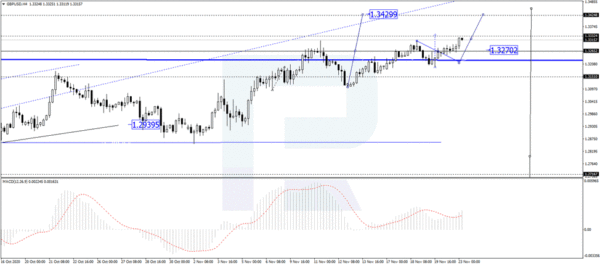
As we can see in the H4 chart, after breaking 1.3264 to the upside, GBP/USD continues growing with the target at 1.3424. Possibly, today the pair may reach 1.3343 and then correct to test 1.3264 from above. Later, the market may form one more ascending wave towards the above-mentioned target. From the technical point of view, this scenario is confirmed by MACD Oscillator: its signal line is moving upwards inside the histogram area.

In the H1 chart, the asset is forming the fifth structure of the ascending wave to reach 1.3343. After that, the instrument may start a correctional pattern, Flag, towards 1.3264 at least and then form one more ascending wave to break 1.3343. Later, the market may continue moving upwards with the target at 1.3364. From the technical point of view, this scenario is confirmed by Stochastic Oscillator: its signal line is moving above 80, which suggests that the market is trading within the “overbought area” and may start a new correction on the price chart.


 Signal2forex.com - Best Forex robots and signals


