How to Read Signal Potential from IGCS Sentiment
IG Client Sentiment data is based off of live IG retail client trades for a range of markets, allowing traders to determine client positioning by showing the percentage of traders holding long and short positions at any given time.
This article will discuss IGCS as a contrarian indicator, illustrating how to read signal potential from this data.
IGCS as a Contrarian Indicator
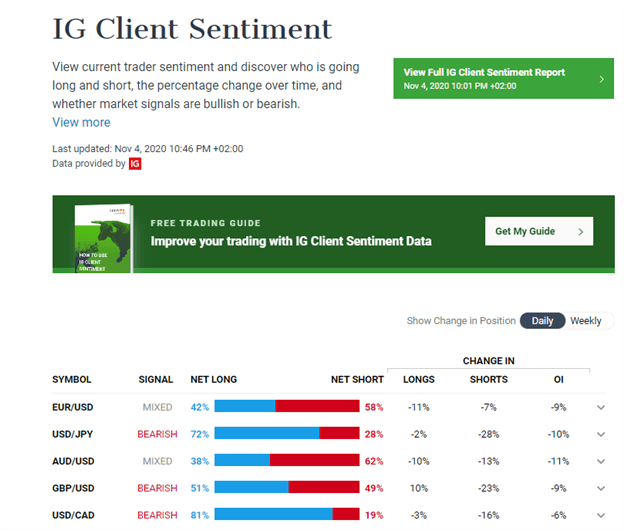
IGCS is a sentiment analysis tool which focuses on the client positioning of retail traders across a range of markets, including currency pairs, indices, commodities and cryptocurrencies. The rationale behind this concept is that retail traders have the tendency to follow the crowd and often attempt to call tops and bottoms, failing to recognize that the market may be reaching extreme levels. When trading on sentiment, traders may use IGCS as a contrarian indicator to assess when the market may be reaching extreme levels, specifically when retail traders present a strong bullish or bearish directional bias (usually a IGCS reading of 60% or more towards either side), resulting in divergence between IGCS and price action, illustrating the effect of crowd psychology on traders. This information is accessible on the sentiment report page where a summary table will appear with the detailed reports further down the page.


Recommended by Tammy Da Costa
How can Client Sentiment add value to your strategy?
An example of the contrarian nature of IGCS is shown below, where client sentiment shows a strong bullish bias in USD/CAD, with 81% of retail traders holding net-long positions (represented by the blue bar), expecting the price of USD/CAD to rise, while only 19% of retail traders are holding net-short positions, with the ratio of traders long to short at 4.26:1.
Generally, when the ratio levels is greater than +/2 (negative for majority net-short and positive for net-long positions), the short-term trading signal generated would be in the opposite direction. In this instance, there is a large disproportion between bullish and bearish sentiment, resulting in a bearish trading signal being generated, suggesting that the prices may continue to fall.

To interpret the data and for a better understanding of how the trading signal is determined, a visual representation of client positioning is shown on the sentiment report, illustrating the relationship between IGCS (the shaded areas) and price action (red and green candles).


Recommended by Tammy Da Costa
Enhance your education with Traits of Successful Traders
When there is a large discrepancy between long and short positions, this means that there is a strong directional bias in IGCS, with the blue shaded area representing the percentage of retail traders holding net-long positions and the red shaded area representing percentage of retail traders holding net-short positions.
As shown below, although USD/CAD is in a downtrend, with prices consistently decreasing from June to September, retail traders continue to accumulate long positions while institutions and large investors accumulate short positions, further driving price action towards the downside until mid-September, where IGCS displayed an extreme bullish reading (outlined in orange), while the underlying market trend remained bearish.
However, as the percentage of traders holding net-short positions increases, prices begin to increase, narrowing the gap between the bulls and bears. But, shortly after, net-long positions increase, resulting in a bearish continuation and further divergence (shown in purple), demonstrating the manner in which IGCS may function as a leading indicator, highlighting trend continuation potential.

Confirming Signals with Technical Analysis
Although IGCS may be used as a guide for potential short-term signals, trading trends with IGCS alone is not recommended since there are other factors that may contribute to changes in price action, including technical and fundamental analysis. However, incorporating IGCS into a trading strategy may assist in identifying potential trading opportunities but should be confirmed using other forms of analysis before entering a trade.


Recommended by Tammy Da Costa
Building Confidence in Trading
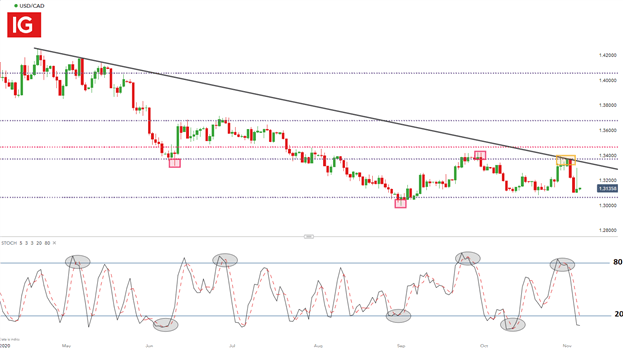
The daily USD/CAD chart, highlights the way in which technical indicators and price action may be used to confirm potential signals provided by IGCS before identifying potential entry and exit points. For USD/CAD, a series of lower highs and lower lows confirms that a downward trend has persisted, with a trendline connecting at least three of these points. In addition to this the stochastic oscillator, a technical indicator used to indicate overbought and oversold conditions, can further assist in identifying potential trading opportunities. When the stochastic is trading below 20, the market is said to be oversold while reading above 80 indicate that the market may be overbought.
By comparing the chart below with the client positioning graph, one is able to see how IGCS has assisted in providing signals of changes in the trend or trend continuation; which is confirmed by the signals provided by the technical indicators, demonstrating the way in which IGCS can be used as both a leading and contrarian indicator.
USD/CAD Daily Chart

Learn More About Sentiment Analysis
Looking to trade in a simulated environment to better learn strategies, tactics and approach? Click here to request a free demo with IG group.


 Signal2forex.com - Best Forex robots and signals


