
📑 Table of Contents
- 1. What Are Moving Averages?
- 2. Why Moving Averages Are Essential for Trend Trading
- 3. SMA vs EMA — Which Is Better for Trend Trading?
- 4. The 200 DMA Trend Filter Strategy
- 5. Moving Average Crossover Strategies
- 6. Multi-Moving Average Strategies
- 7. Best Moving Average Settings by Timeframe
- 8. How to Stay in the Trade — Trailing with Moving Averages
- 9. Pros and Cons of Moving Averages in Trend Trading
- 10. Common Mistakes When Using Moving Averages
- 11. Frequently Asked Questions
1. What Are Moving Averages?
Moving averages are one of the most widely used technical indicators in forex and financial trading. They smooth out price data by calculating the average price over a specific number of periods, helping traders identify the direction of the trend and filter out market noise. By removing short‑term fluctuations, moving averages provide a clearer picture of the underlying trend.
There are several types of moving averages, each with its own characteristics and best‑use cases.
Simple Moving Average (SMA)
The Simple Moving Average (SMA) calculates the average price over a specified number of periods, giving equal weight to each price point. This makes the SMA smoother and slower to react to price changes, which is useful for identifying long‑term trends without being distracted by short‑term volatility.
Exponential Moving Average (EMA)
The Exponential Moving Average (EMA) gives more weight to recent prices, making it more responsive to new information. During a sharp price decline, the EMA turns down before the SMA does; during a sharp recovery, it turns up first. This makes the EMA better suited for short‑term trading and momentum strategies.
Weighted Moving Average (WMA)
The Weighted Moving Average (WMA) assigns a linearly decreasing weight to older prices, with the most recent price receiving the highest weight. This makes the WMA even more responsive than the EMA, though it is less commonly used in forex trading.
2. Why Moving Averages Are Essential for Trend Trading
Moving averages are the foundation of many trend‑following strategies. They provide a systematic way to identify and trade trends.
Identifying the Trend Direction
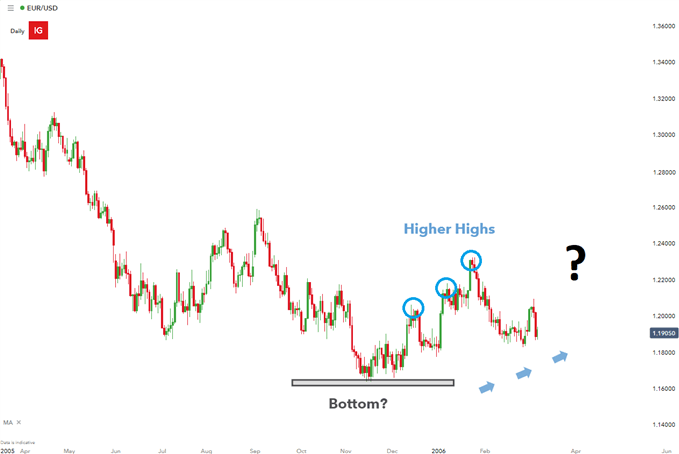
The most basic use of a moving average is to determine the trend direction. When price is above a rising moving average, the trend is considered bullish. When price is below a falling moving average, the trend is considered bearish. Traders can use the 200‑period moving average as a long‑term trend filter — staying above 200 MA suggests a bullish regime; falling below it suggests a bearish one.
Filtering Market Noise
Price action can be erratic, with frequent whipsaws and false signals. Moving averages smooth out this noise, allowing traders to focus on the broader trend rather than short‑term fluctuations. This is especially valuable in volatile markets where price can move sharply in both directions.
Dynamic Support and Resistance
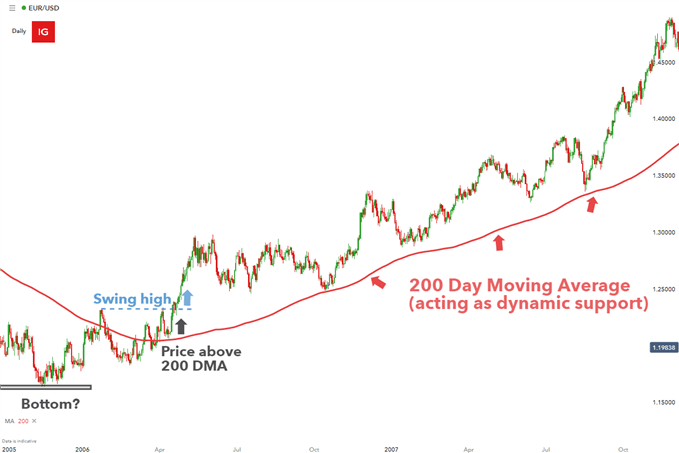
In strong trends, moving averages often act as dynamic support (in an uptrend) or dynamic resistance (in a downtrend). Price frequently pulls back to the moving average before resuming the trend, providing traders with high‑probability entry opportunities.

3. SMA vs EMA — Which Is Better for Trend Trading?
The choice between SMA and EMA depends on your trading style. SMA is better for identifying established long‑term trends, while EMA is better for reacting quickly to momentum shifts. The table below summarises the key differences.
| Feature | SMA (Simple Moving Average) | EMA (Exponential Moving Average) |
|---|---|---|
| Weighting | Equal weight on all prices | More weight on recent prices |
| Reactivity | Slower, smoother | Faster, more responsive |
| Best Use | Long‑term trend identification | Short‑term momentum trading |
| Lag | More lag | Less lag |
| Whipsaw | Less prone to false signals | More prone to false signals in choppy markets |
| Common Periods | 50, 100, 200 | 9, 12, 20, 50 |
📌 SMA is best for long‑term trend confirmation, while EMA is best for short‑term entry timing. Many traders use both: EMA for entry signals and SMA for trend confirmation.
4. The 200 DMA Trend Filter Strategy
The 200‑day Simple Moving Average (200 DMA) is one of the most widely followed trend filters in the financial markets. It is considered a key long‑term trend indicator because it averages 200 days of price data — roughly one year of trading activity.
What Is the 200 DMA?
The 200 DMA is a long‑term moving average that smooths out price data over a 200‑period window. It is commonly used by institutional traders and investors to gauge the long‑term health of a trend. As a rule of thumb, when price is above the 200 DMA, the market is considered to be in a long‑term uptrend; when below, it is in a long‑term downtrend.
Using 200 DMA to Identify the Trend
Traders use the 200 DMA as a trend filter to determine which side of the market to trade. If the price is above the 200 DMA, traders focus on buy setups. If the price is below, traders focus on sell setups. This simple rule helps avoid counter‑trend trades.
Entry and Exit Rules with 200 DMA
- Entry (Bullish): Price is above the 200 DMA, and price pulls back to the 200 DMA with a bullish reversal candlestick pattern.
- Entry (Bearish): Price is below the 200 DMA, and price rallies to the 200 DMA with a bearish reversal candlestick pattern.
- Exit: Consider exiting when price closes below the 200 DMA (bullish) or above the 200 DMA (bearish), as it signals a potential trend change.
5. Moving Average Crossover Strategies
Moving average crossovers are among the most popular trend‑following strategies. They involve using two moving averages — a faster (short‑term) and a slower (long‑term) — to generate buy and sell signals.
Golden Cross (50/200)
The Golden Cross occurs when the 50‑period moving average crosses above the 200‑period moving average. This is a widely followed bullish signal, historically interpreted as the start of a long‑term bull market.
Death Cross (50/200)
The Death Cross occurs when the 50‑period moving average crosses below the 200‑period moving average. This is a widely followed bearish signal, suggesting that momentum has shifted to the downside.
12/26 EMA Crossover
The 12/26 EMA crossover is a short‑term momentum strategy often used with the MACD indicator. When the 12 EMA crosses above the 26 EMA, it generates a buy signal. When it crosses below, it generates a sell signal.
6. Multi-Moving Average Strategies
Using multiple moving averages simultaneously can provide more robust trend confirmation. A common approach is the stacked EMA configuration, where faster EMAs are above slower EMAs in a bullish trend, and below in a bearish trend.
| Strategy | Entry Signal | Exit Signal | Best Market | Risk Level |
|---|---|---|---|---|
| Golden Cross | 50 MA crosses above 200 MA | 50 MA crosses below 200 MA | Strong uptrends | Low-Medium |
| Death Cross | 50 MA crosses below 200 MA | 50 MA crosses above 200 MA | Strong downtrends | Low-Medium |
| 12/26 EMA Crossover | 12 EMA crosses above 26 EMA | 12 EMA crosses below 26 EMA | Medium-term trends | Medium |
| Stacked EMAs | EMAs aligned (9 > 21 > 50) | EMAs diverge | Strong trends | Low |
📌 Multi-MA strategies reduce false signals by requiring confirmation across multiple timeframes.
7. Best Moving Average Settings by Timeframe
The optimal moving average period depends on your trading timeframe and style. Short‑term traders benefit from faster MAs like the 9 or 20 EMA, while long‑term investors rely on slower MAs like the 50, 100, or 200.
| Timeframe | Short-Term MA | Medium-Term MA | Long-Term MA | Best Use |
|---|---|---|---|---|
| 1-Minute | 9 EMA | 21 EMA | 50 SMA | Scalping |
| 5-Minute | 9 EMA | 21 EMA | 50 SMA | Scalping |
| 15-Minute | 12 EMA | 26 EMA | 50 SMA | Day trading |
| 1-Hour | 20 EMA | 50 SMA | 200 SMA | Swing trading |
| 4-Hour | 20 EMA | 50 SMA | 200 SMA | Swing trading |
| Daily | 20 EMA | 50 SMA | 200 SMA | Position trading |
| Weekly | 20 EMA | 50 SMA | 200 SMA | Long-term analysis |
📌 These are general guidelines. Always test and adjust settings based on the specific market and asset you are trading.
8. How to Stay in the Trade — Trailing with Moving Averages
One of the most powerful applications of moving averages is using them as a trailing stop. In a strong trend, price often respects the moving average as dynamic support or resistance, providing a systematic way to stay in a trade and protect profits.
How it works:
- Bullish trend: Use the rising 50‑period or 200‑period moving average as a trailing stop. As long as price remains above the MA, stay in the trade. If price closes below the MA, exit.
- Bearish trend: Use the falling 50‑period or 200‑period moving average as a trailing stop. As long as price remains below the MA, stay in the trade. If price closes above the MA, exit.
- Adaptive approach: Some traders use the 20 EMA for more sensitive trailing stops in fast‑moving trends, and the 50 or 200 SMA for slower, more reliable trailing stops.
9. Pros and Cons of Moving Averages in Trend Trading
Like any trading tool, moving averages have strengths and weaknesses. Understanding both is essential for using them effectively.
| Pros | Cons |
|---|---|
| Easy to interpret — simple visual representation of trend | Lagging indicator — signals come after price moves |
| Flexible — can adjust period to suit any timeframe | Ineffective in ranging markets — generates false signals |
| Large data set — 200 DMA considers 200 price points | Delayed entry — price may have already moved significantly |
| Dynamic support/resistance — acts as trend filter | Whiplash in volatile markets — frequent crossover signals |
| Works across all markets — forex, stocks, commodities | No predictive power — only confirms what already happened |
📌 The key to success with moving averages is not the indicator itself — it is how you use it in conjunction with other tools and proper risk management.
10. Common Mistakes When Using Moving Averages
Even experienced traders make mistakes with moving averages. Avoid these common pitfalls to improve your trend‑trading results.
| Mistake | Why It’s Harmful | How to Fix |
|---|---|---|
| Using MA as a standalone signal | Can give false signals in choppy markets | Combine with price action and other indicators |
| Trading every crossover | Whipsaws in ranging markets | Filter with trend confirmation |
| Using wrong period for timeframe | Too short = whipsaw; too long = too laggy | Match MA period to your trading timeframe |
| Ignoring higher timeframe context | Can trade against the bigger trend | Always check higher timeframe MA alignment |
| Not adjusting for volatility | Fixed periods don’t work in all conditions | Consider adaptive or multiple MAs |
📌 The most successful traders use moving averages as part of a broader system, not as a standalone signal.
11. Frequently Asked Questions
What is trend trading with moving averages?
Trend trading with moving averages is a strategy that uses moving average indicators to identify the direction of the trend and generate entry and exit signals. Moving averages smooth price data to reveal the underlying trend direction and act as dynamic support/resistance levels.
What is the 200 DMA and how is it used?
The 200 DMA (200‑day Simple Moving Average) is a widely used trend filter that helps traders identify the long‑term trend direction. When price is above the 200 DMA, the trend is considered bullish; when below, the trend is bearish. It should be used as a trend filter, not an entry signal.
What is the difference between SMA and EMA?
SMA (Simple Moving Average) gives equal weight to all price points, making it slower and smoother. EMA (Exponential Moving Average) gives more weight to recent prices, making it more responsive to short‑term price changes. EMA is better for short‑term trading; SMA is better for long‑term trends.
What is the Golden Cross in moving average trading?
The Golden Cross occurs when the 50‑period moving average crosses above the 200‑period moving average, signalling a potential long‑term bull market. It is one of the most widely followed bullish signals in technical analysis.
What is the Death Cross in moving average trading?
The Death Cross occurs when the 50‑period moving average crosses below the 200‑period moving average, signalling a potential long‑term bear market. It is a widely followed bearish signal.
How can I use moving averages to stay in a trade?
Use the moving average as a trailing stop. As long as price remains above the rising moving average (in an uptrend) or below the falling moving average (in a downtrend), the trend is considered intact. A break below/above the MA can signal a potential exit.
What are the best moving average settings for forex?
Common settings include: 9/21/50 for short‑term trading, 20/50/200 for swing trading, and 50/200 for long‑term trend identification. The optimal settings depend on your trading timeframe and style.
Can moving averages be used in ranging markets?
Moving averages are less effective in ranging markets as they generate frequent false signals. They work best in trending markets where there is a clear directional movement. In ranging markets, consider using oscillators like RSI instead.
What is the 12/26 EMA crossover strategy?
This strategy uses a 12‑period and 26‑period EMA. When the 12 EMA crosses above the 26 EMA, it generates a buy signal. When it crosses below, it generates a sell signal. This is one of the most widely used EMA crossover strategies.
What is the most reliable moving average for trend trading?
The 200 SMA is widely regarded as the most reliable for long‑term trend identification due to its large data set and ability to filter out market noise. For shorter‑term trading, the 50 EMA or 20 EMA are popular choices.
📈 Master Your Entry and Exit Timing: Moving averages are powerful trend filters, but knowing when to act on their signals is just as important. Learn the art of How and When to Buy or Sell in Forex Trading — a comprehensive guide to entry and exit strategies that perfectly complements your moving average trend‑following approach.
⚡ Navigate Volatility Like a Pro: Moving averages are essential tools for managing volatility and identifying trends. Take your skills to the next level with our guide on Currency Volatility — What It Is & How to Trade It, helping you understand market conditions and adapt your moving average strategies accordingly.



 Signal2forex.com - Best Forex robots and signals


