U.S. stocks may take some time to recover from their violent plunge in the last two weeks, if history is any guide.
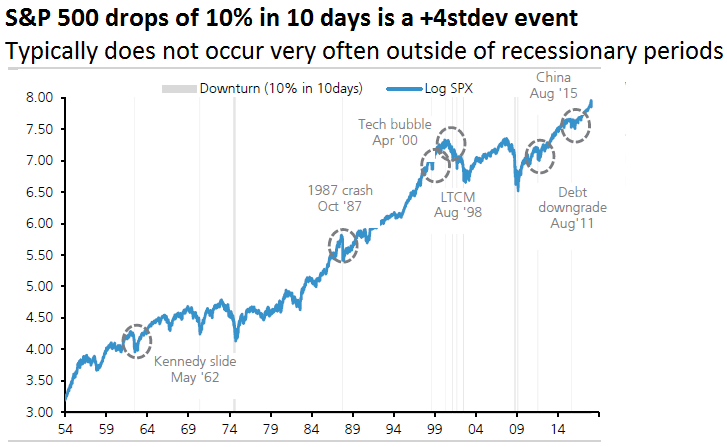
The S&P 500 dropped 10 percent into correction territory in just nine trading days, the fastest on record (outside of market crashes), according to Ryan Detrick, senior market strategist at LPL Financial. The stock index hit a record high on Friday, Jan. 26, but closed 10.16 percent below that high on Thursday, Feb. 8.
Analysis from Kensho, a quantitative analytics tool used by hedge funds, looked at seven occasions of similarly sharp drops in the S&P 500 beginning in 1987. The study found that following such a drop, stocks tended to fall further, with a median decline of 2.29 percent one week later and a drop of 1.68 percent two weeks later.
Source: UBS
The bulk of the S&P’s losses occurred Friday, Feb. 2, and the following Monday, when the stock index dropped 4.1 percent in its worst day in more than six years. That marked the S&P’s second straight decline of more than four standard deviations — a statistical measure of distance from an average — a phenomenon that has only occurred twice since 1980. The first was in October 1987, shortly after Black Monday, and the second was in August 2015, as stocks fell following a surprise devaluation in the Chinese yuan.
The week after four days following such a drop, the past Friday in this case, the S&P has fallen a median 0.98 percent, according to Kensho.
The volatile sell-off of the last two weeks broke more than a year of historical calm in markets. Stocks fell as investors worried about rising interest rates.
“I think overall we’re going to see a little more shaking in the markets as the 10-year [yield] trades to three” percent, said CNBC’s Jon Najarian, co-founder of Investitute.com.
“In my mind especially, it’s like we went from the giant slalom to speed skating and you don’t have as much time to adjust,” he said, noting the speed of machine-driven trading last week made it difficult for human traders to react.
The U.S. 10-year Treasury yield hit a four-year high last week and rose further Monday to 2.902 percent, its highest since Jan. 15, 2014.
Najarian also noted that last week, traders nearly doubled their bets on “puts,” or options to sell stocks at a set price, versus a moderate increase in “calls,” or options to buy. “Those are really extended and usually not very sustainable put-call ratios,” he said.
In the drop of the last two weeks, the S&P 500 briefly broke through key technical levels of support, notably its 200-day moving average. The benchmark index tried to recover its 100-day moving average in Monday trading.
“While we believe most of the price damage is over for this correction, we do not think we are going to return to the same level of low volatility of the recent past,” Morgan Stanley’s chief U.S. equity strategist Michael Wilson said in a Monday report. “We do not expect a quick return to the prior highs although we do think higher highs for the S&P 500 are likely ahead of us before the cycle top later this year.”
Wilson’s year-end S&P 500 target is 2,750, about 5 percent above Friday’s close but below the Jan. 26 intraday record of 2,872.87. The S&P 500 remains in its second-longest bull market in history.
Disclosure: CNBC’s parent NBCUniversal is a minority investor in Kensho.
Link to the source of information: www.cnbc.com


 Signal2forex.com - Best Forex robots and signals


