EUR/USD Finds Resistance In 1.1915
Despite passing the resistance of the 1.1900 mark, the EUR/USD did not book large gains. The 1.1915 level provided resistance and stopped the rate’s surge. It was spotted on Wednesday that this level provided both support and resistance to the...
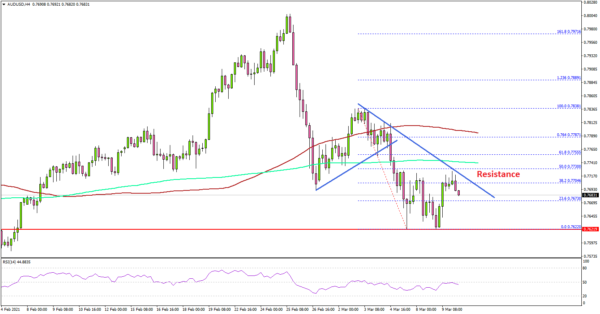
AUD/USD: Upsides Could Be Limited Above 0.7800
Key Highlights AUD/USD declined from well above 0.7900 and tested 0.7620. A key bearish trend line is forming with resistance near 0.7735 on the 4-hours chart. EUR/USD declined to 1.1835, GBP/USD is consolidating above 1.3800. The US Consumer Price Index...

XAU/USD Outlook: Limited Correction To Precede Bearish Continuation
Spot gold rose from new nine-month low ($1676) on Tuesday, as dollar bulls are pausing and technical studies on daily chart are oversold, providing temporary support to the metal. Overall picture remains negative for gold, as global growth recovery and...
USD/JPY Outlook: Overbought Daily Studies Warn Of Correction Before Bulls Continue
Bulls are taking a breather on Tuesday, following strong bullish acceleration in past eight days which peaked at 109.23 today (the highest since June 8), but faced headwinds from 200WMA (109.00) and Fibo 38.2% of 2015/2016 125.84/98.99 fall (109.25). Bulls...
AUDUSD’s Downside Risks Persist as Descent Stalls
AUDUSD’s intact negative trajectory, from a 3-year high reached at the end of February, has paused around the area between the latest lows of 0.7621 and 0.7635 respectively. The falling red Tenkan-sen line is assisting the price dive beneath the...

US 500 Index Hovers Between Short-term SMAs
The US 500 index (Cash) is trading below the record high of 3,963.58, flirting with the 20- and 50-day simple moving averages (SMAs). The momentum indicators are suggesting a downside reversal as the MACD is losing ground below its trigger line...
US 500 Index Hovers Between Short-term SMAs
The US 500 index (Cash) is trading below the record high of 3,963.58, flirting with the 20- and 50-day simple moving averages (SMAs). The momentum indicators are suggesting a downside reversal as the MACD is losing ground below its trigger line...
US 500 Index Hovers Between Short-term SMAs
The US 500 index (Cash) is trading below the record high of 3,963.58, flirting with the 20- and 50-day simple moving averages (SMAs). The momentum indicators are suggesting a downside reversal as the MACD is losing ground below its trigger line...
US 500 Index Hovers Between Short-term SMAs
The US 500 index (Cash) is trading below the record high of 3,963.58, flirting with the 20- and 50-day simple moving averages (SMAs). The momentum indicators are suggesting a downside reversal as the MACD is losing ground below its trigger line...
US 500 Index Hovers Between Short-term SMAs
The US 500 index (Cash) is trading below the record high of 3,963.58, flirting with the 20- and 50-day simple moving averages (SMAs). The momentum indicators are suggesting a downside reversal as the MACD is losing ground below its trigger line...
Join us on Facebook
 Signal2forex.com - Best Forex robots and signals
Do you want to have such profits and charts? Click for more info…

Recommended fast VPS provider

I have been with this company for the second month with a v.11+ VPS robot with a smaller deposit and I am satisfied. For a monthly fee of $30 from the second month, I don’t have to worry about anything and just watch the earnings. The robot earns, the Skype support is excellent and you can see that it understands trading. In the future, I will definitely increase the deposit for full use of the robot to 14 pairs. I recommend Signal2forex!!!!!

From the beginning I didn’t trust the EA robot FOREX V PORTFOLIO v.11 pro 14 because I had other trades than shown in the video on the website. After a month on two demo accounts with a deposit of 2000 USD, I must say that the EA works very well!!! Monthly appreciation of both accounts approx. 30% with max DD 19%. I have to praise the developers and keep my fingers crossed for the future.

Guys are geniuses!!! I am grateful for your work!!! Everything works, they helped me install everything and there is always feedback !!! Thanks!!!

Trading education

Introduction to Basic Trendline AnalysisIn this series we will piece together the anatomy of a swing trade and discuss ... 
Daily Forex Trading Course Walkthrough: Part TwoForex Trading Course Walkthrough Talking Points: This is the second of a ten-part series in ... 
Forex Trading Truth or Lie? Uncovering the Truths of FX TradingDo you know the truths about forex trading? Traders face a barrage of information when ... 
Daily Forex Trading Course Walkthrough: Part FiveForex Trading Course Walkthrough Talking Points: This is the fifth of a ten-part series in ... |