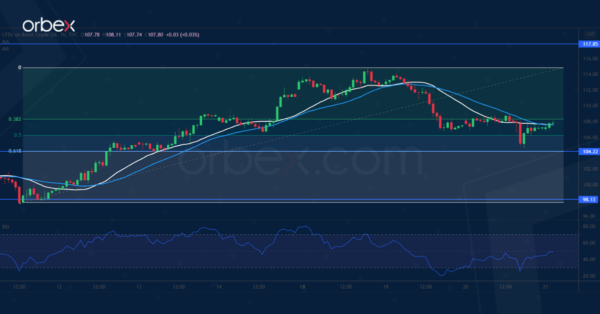
UK Oil Bounces Off Support
Brent crude finds support from a surprise drawdown in inventories. On the daily chart, the price is taking a breather in a flag-shaped pattern after a parabolic ascent. The uptrend can remain intact as long as the support of 98.00...

S&P 500 Wave Analysis
S&P 500 reversed from support level 4400.00 Likely to rise to resistance level 4500.00 S&P 500 index recently reversed up from the support level 4400.00 (the former monthly low from March) intersecting with the 61.8% Fibonacci correction of the upward...

GBP/USD Vulnerable to a Drop Below 1.3000
Key Highlights GBP/USD is struggling to clear the 1.3150 resistance zone. A crucial bearish trend line is forming with resistance near 1.3120 on the 4-hours chart. EUR/USD is still trading in a bearish zone below 1.0920. Gold price extended gains,...

EUR/USD Pair Moved into a Bearish Zone Below $1.0880
The Euro started a fresh decline from the 1.0925 resistance zone against the US Dollar. The EUR/USD pair declined below the 1.0880 level to move into a bearish zone. The price even traded below the 1.0800 level and the 50...

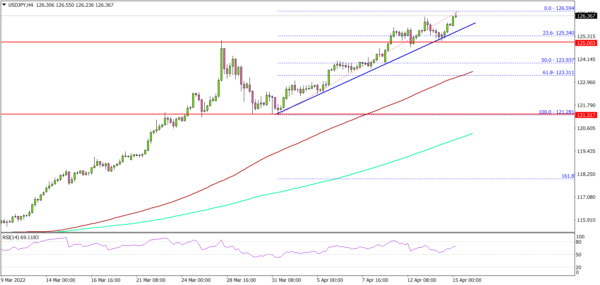
USD/JPY Hits New Multi-Year High, 130 Next?
Key Highlights USD/JPY started a fresh surge and traded above 125.00. A major bullish trend line is forming with support near 125.75 on the 4-hours chart. It traded to a new multi-year high at 126.59 and might continue to rise....

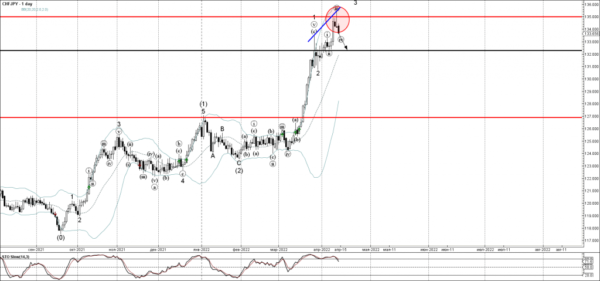
GBPJPY Wave Analysis
GBPJPY reversed from key round resistance level 164.65 Likely to fall to support level 163.00 GBPJPY today recently reversed down from the key resistance level 164.65 (previous monthly high from March) – coinciding with the upper daily Bollinger Band. The...

ETHUSD rebounds after 50-SMA rejects decline; bias bearish
ETHUSD (Ethereum) has been experiencing a downside correction after its short-term uptrend stalled at the 3,590 region last week. Although the 50-day simple moving average (SMA) paused the price’s recent pullback, it seems like the cryptocurrency lacks the necessary momentum...

WTI Wave Analysis
WTI reversed from key support level 93.50 Likely to rise to resistance level 105.00 WTI crude oil today reversed up sharply from the key support level 93.50 (which formed the daily Mornign Star in March) – standing near the 38.2%...

Natural Gas Futures Hit 13-Year High in Overbought Zone
Natural gas futures (May delivery) further brightened their long-term bullish outlook on Tuesday, stretching their impressive five-week rally to a new 13-year high of 6.825. Despite the clear positive pattern in the market, which is well endorsed by the upward-sloping...

US 500 Index’s Positive Tone Shaky Near 38.2% Fibonacci
The US 500 stock index (Cash) is consolidating slightly north of the 4,446 level, which is the upper part of a support border and coincidentally the 38.2% Fibonacci retracement level of the up wave from 4,137 until 4,638. The rolling...

 Signal2forex.com - Best Forex robots and signals


