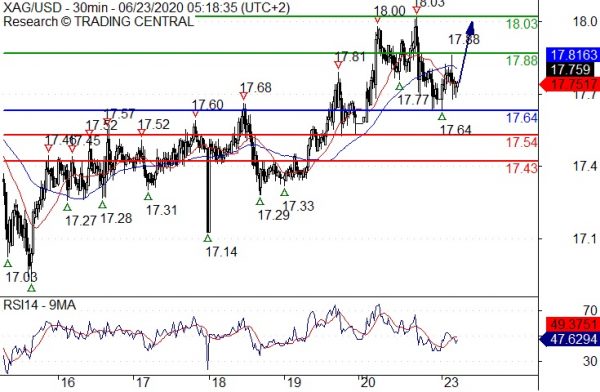
Silver Spot: The Bias Remains Bullish
Pivot (invalidation): 17.6400 Our preference Long positions above 17.6400 with targets at 17.8800 & 18.0300 in extension. Alternative scenario Below 17.6400 look for further downside with 17.5400 & 17.4300 as targets. – advertisement – Comment A support base at 17.6400...
GBP/AUD in a Bearish Market – Elliott Wave Analysis
GBPAUD is bearish, now unfolding a five-wave decline into a higher degree wave 3, down from 2.059 level. We specifically see price in a sub-wave v of 3, therfore be aware of a temporary low and support at the 1.77/1.75...
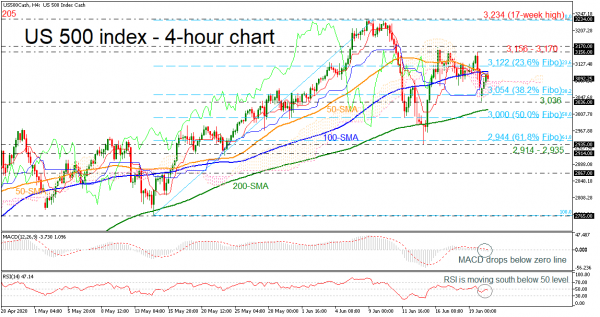
US 500 Index Holds Marginally Below 100-SMA; Bullish in Long Term
The US 500 cash index found strong resistance around the 100-period simple moving average (SMA) over the last session, sending the indicators lower as well. The MACD is heading south below zero and its trigger line, while the RSI is pointing down below...
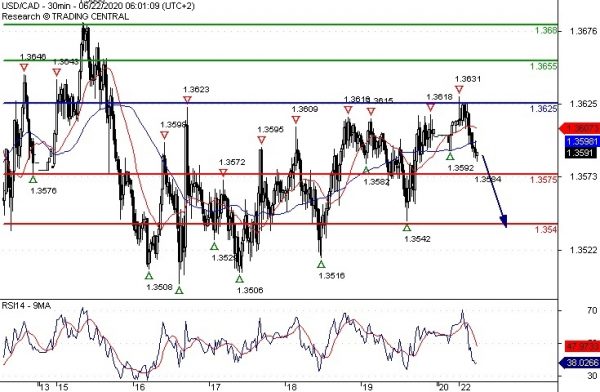
USD/CAD: Turning Down
Pivot (invalidation): 1.3625 Our preference Short positions below 1.3625 with targets at 1.3575 & 1.3540 in extension. Alternative scenario Above 1.3625 look for further upside with 1.3655 & 1.3680 as targets. – advertisement – Comment The RSI is bearish and...
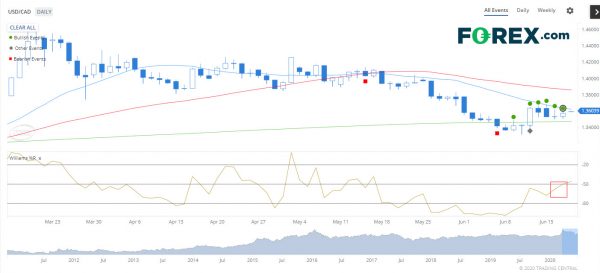
Bullish Technical Event Alert USD/CAD
Is there a new uptrend emerging in the USD/CAD? Using the “technical Insight” research tool under the Market Analysis tab, we have identified a short-term Bullish technical event in the USD/CAD. Williams %R short term bullish signal confirmed on USD/CAD...
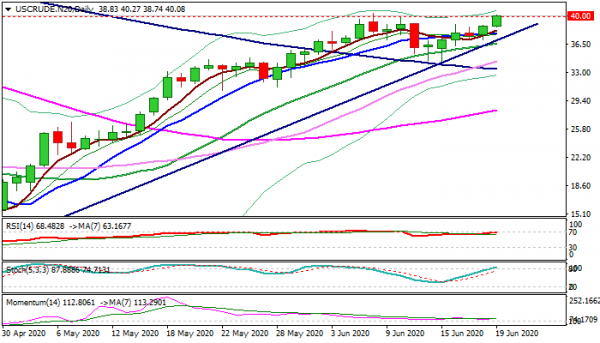
WTI OIL Outlook: Fresh Optimism Lifts Oil Price above $40 Barrier Again
WTI oil probes again through psychological $40 barrier on Friday after the first attack on 8 Jun failed. Bullish sentiment was restored after completion of shallow $40.41/$34.33 pullback on renewed hopes of improvement in global demand, with growing fears of...
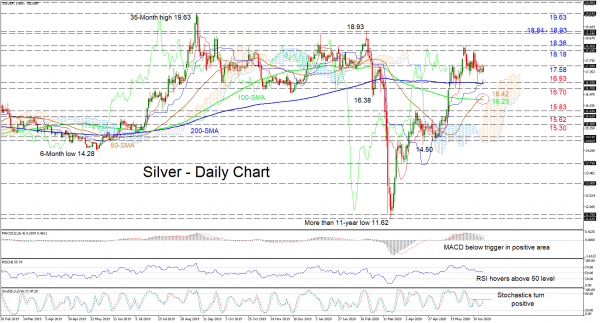
Silver Remains Positive, Bounces On 200-Day SMA
Silver is attempting to push back above the 17.58 key mark, after a retracement from the 18.36 peak bounced off the 200-day simple moving average (SMA). The recent bullish crossover of the 100-day SMA by the rising 50-day one may...
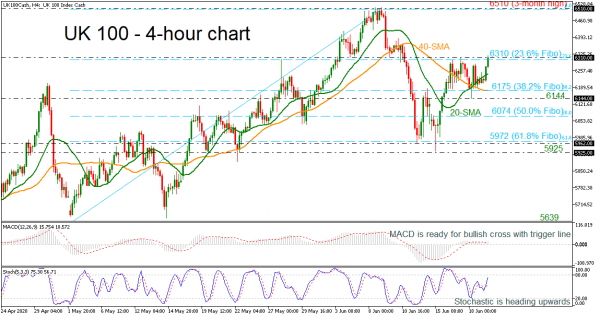
UK 100 Index Attempts To Climb Above 23.6% Fibo
The UK 100 cash index is pushing efforts to extend buying pressure above the 23.6% Fibonacci retracement level of the up leg from 5,639 to 6,510 at 6310, having climbed above the bullish crossover within the 20- and 40-period simple...
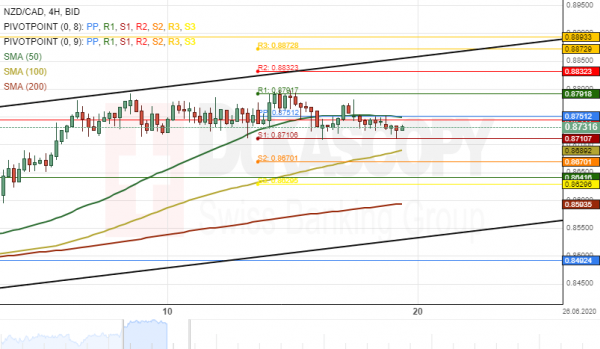
NZD/CAD 4H Chart: Traded Sideways
The New Zealand Dollar has been trading sideways against the Canadian Dollar since June 5. The currency pair consolidated between the 0.8800/0.8700 level during the past two weeks. Technical indicators flash mixed signals on both the smaller and the larger...
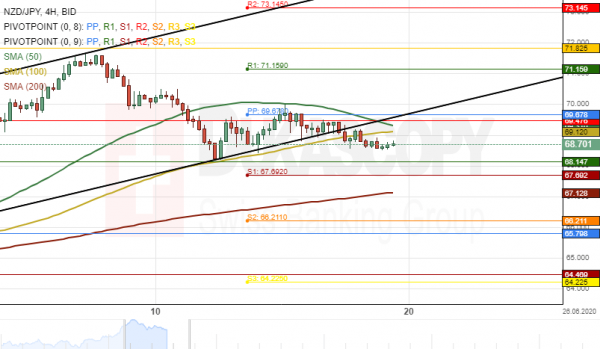
NZD/JPY 4H: Breakout Occurs
The New Zealand Dollar has declined by 303 pips or 4.23% against the Japanese Yen since last week’s trading sessions. A breakout occurred through the lower boundary of an ascending channel pattern on June 18. Given that a breakout had...
Join us on Facebook
 Signal2forex.com - Best Forex robots and signals
Do you want to have such profits and charts? Click for more info…

Recommended fast VPS provider

I have been with this company for the second month with a v.11+ VPS robot with a smaller deposit and I am satisfied. For a monthly fee of $30 from the second month, I don’t have to worry about anything and just watch the earnings. The robot earns, the Skype support is excellent and you can see that it understands trading. In the future, I will definitely increase the deposit for full use of the robot to 14 pairs. I recommend Signal2forex!!!!!

From the beginning I didn’t trust the EA robot FOREX V PORTFOLIO v.11 pro 14 because I had other trades than shown in the video on the website. After a month on two demo accounts with a deposit of 2000 USD, I must say that the EA works very well!!! Monthly appreciation of both accounts approx. 30% with max DD 19%. I have to praise the developers and keep my fingers crossed for the future.

Guys are geniuses!!! I am grateful for your work!!! Everything works, they helped me install everything and there is always feedback !!! Thanks!!!

Trading education

Introduction to Basic Trendline AnalysisIn this series we will piece together the anatomy of a swing trade and discuss ... 
Daily Forex Trading Course Walkthrough: Part TwoForex Trading Course Walkthrough Talking Points: This is the second of a ten-part series in ... 
Forex Trading Truth or Lie? Uncovering the Truths of FX TradingDo you know the truths about forex trading? Traders face a barrage of information when ... 
Daily Forex Trading Course Walkthrough: Part FiveForex Trading Course Walkthrough Talking Points: This is the fifth of a ten-part series in ... |