
GBPUSD Forms Foothold At 11-Month Low, Bearish Bias Stands
GBPUSD buyers have re-emerged around the 1.3300 handle and lower Bollinger band trying to make a comeback, after a one-week drop in the pair, which produced an 11-month low. The bearish simple moving averages (SMAs) are reinforcing the one-month descent...

Silver Finds Support At 50-SMA, Bearish Bias Holds
Silver has staged a notable rebound after its long-term downtrend halted at the 21.40 region in September. However, in the short term, the precious metal seems to be losing traction, with the bears battling to push the price beneath the...
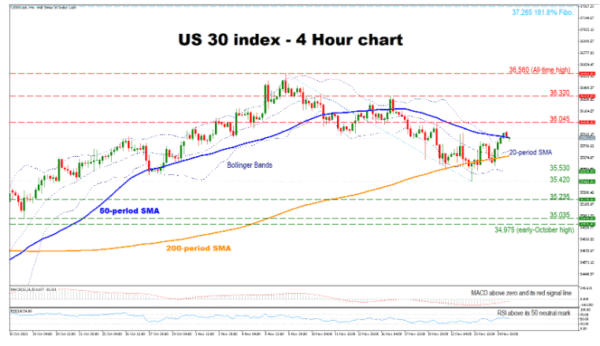
US 30 Retreats From All-Time Highs But Bullish Forces Linger
The US 30 cash index has witnessed a minor pullback from its all-time high at 36,560 earlier this month. However, the overall outlook for the index remains bullish as the price is found above its 200-period simple moving average (SMA).The...
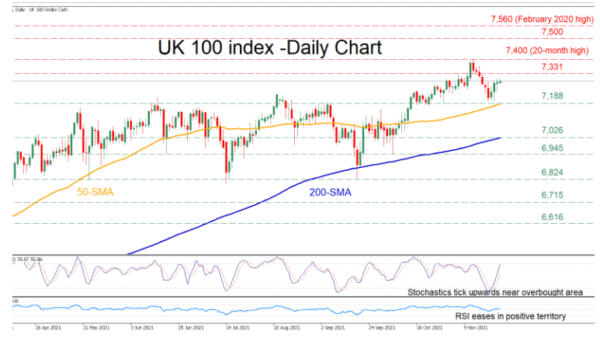
UK 100 Index Pulls Back From Fresh Highs, Bullish Bias Holds
The UK 100 stock index (cash) has been trending upwards since February. However, the index experienced a minor downside correction lately after its rally peaked at the 20-month high of 7,400.This recent pullback is unlikely to continue as the momentum...
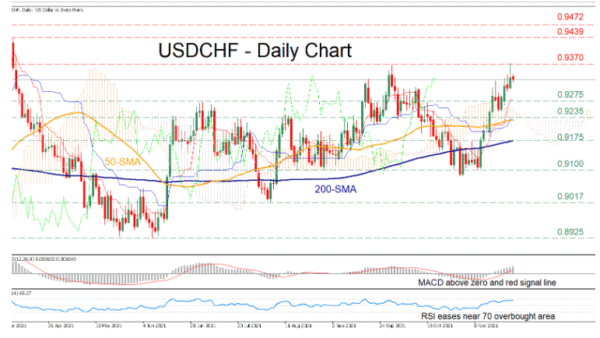
USDCHF Ticks Higher As Bullish Forces Consolidate
USDCHF has been charging higher since June after the price failed to pierce through the 0.8925 region. Although the medium-term uptrend faced a moderate pullback in October, buyers retook control and pushed the price higher.The pair is likely to continue...

GBPJPY Marks Yet More Lower Highs as Bearish Forces Linger
GBPJPY is struggling to gain positive traction amid successive lower highs. Moreover the 50-period simple moving average (SMA) has crossed below the 200-period SMA, increasing fears of a sustained bearish outlook. Short-term momentum indicators are reflecting a mixed picture for...
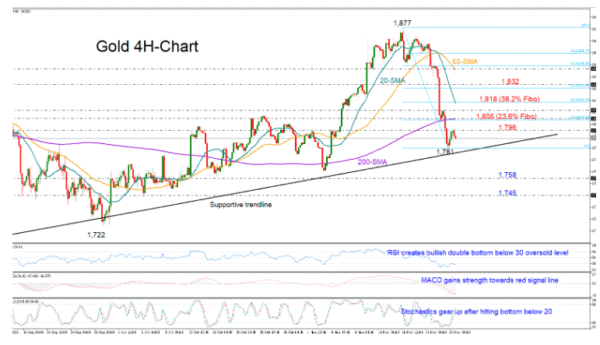
Gold Meets New Resistance But Sell-Off Already Overstretched
Gold could not find enough buying interest to close above the 1,796 resistance on Tuesday despite the bounce off the 20-day low of 1,781 in the four-hour chart. Nevertheless, traders could still derive some optimism from the momentum indicators as...

Elliott Wave View: Dollar Index (DXY) Could Extend The Rally Higher
Short-term Elliott wave view in Dollar Index suggests cycle from October 28 low is in progress as a 5 waves impulse Elliott Wave structure. Up from October 28 low, wave 1 ended at 94.3 and pullback in wave 2 ended...
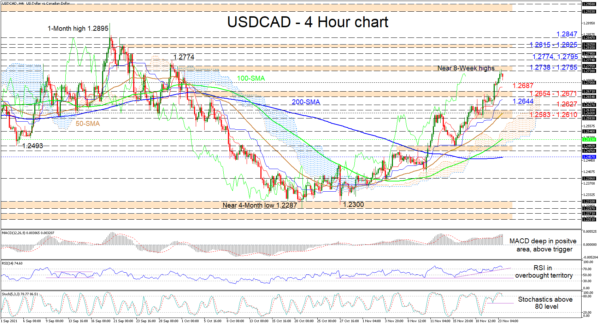
USDCAD Runs Out of Steam at 8-Week Highs, Rally at Risk
USDCAD advances have encountered some downside pressure from the 1.2738-1.2755 obstacle, formed by the October 1 and September 30 highs, hinting that bullish powers may be subsiding. However, the soaring 50- and 100-period simple moving averages (SMAs) are still backing...
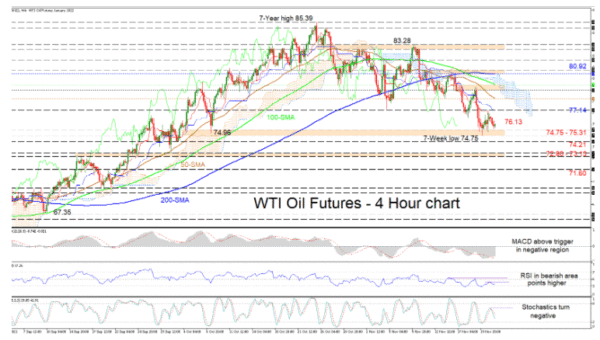
WTI Futures’ Bearish Course In Play, Downside Risks Stand
WTI oil futures have been drifting downhill for the last two-weeks from the 83.28 high, producing lower highs and lows, reinforcing the bearish outlook. The 200-period simple moving averages’ (SMA) positive incline has softened, while the diving 50- and 100-period...

 Signal2forex.com - Best Forex robots and signals


