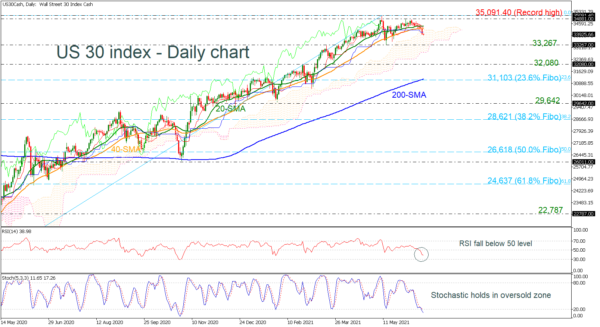
US 30 Index Retreats Below SMAs in Short-Term
The US 30 (Cash) index posted a negative correction movement after it topped at 34,881 in the beginning of the month. The price also declined below the 20- and 40-day simple moving averages (SMAs) and is holding in the Ichimoku cloud. The RSI...
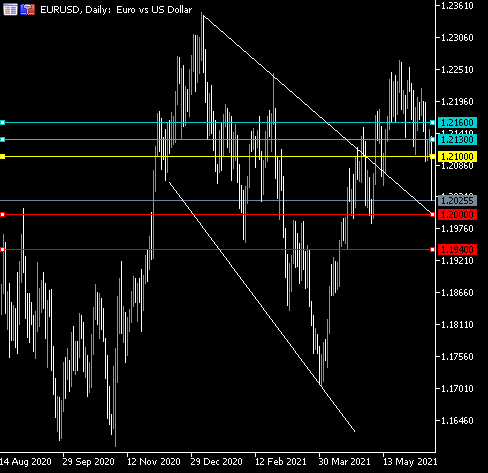
EURUSD 1.2000 Must Hold
The euro currency is appearing very bearish against the US dollar as the greenback gains ground after a more hawkish policy speech from the Federal Reserve than expected. The EURUSD pair is approaching the 1.2000 level which marks the top...

USD/JPY Pair Started a Steady Increase from 109.40 Support
The US Dollar started a steady increase from the 109.40 support zone against the Japanese Yen. The USD/JPY pair even climbed above the 109.80 level to move into a positive zone. The pair is now trading above 110.00 and the...
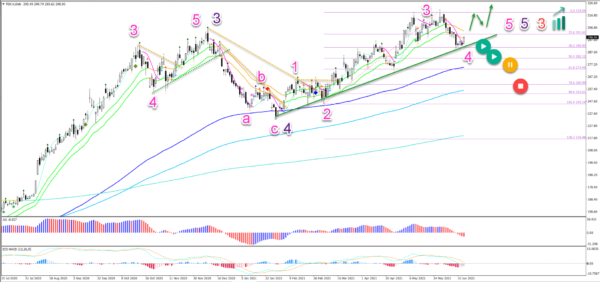
FedEx Completes Wave 4 Pullback At 38.2% Fibonacci
FedEx Corporation (FDX) has made a bullish bounce. But the rebound was even stronger than expected because price action broke above the top. The main targets are located at the -27.2% Fibonacci level at $340 and the -61.8% Fibonacci level...
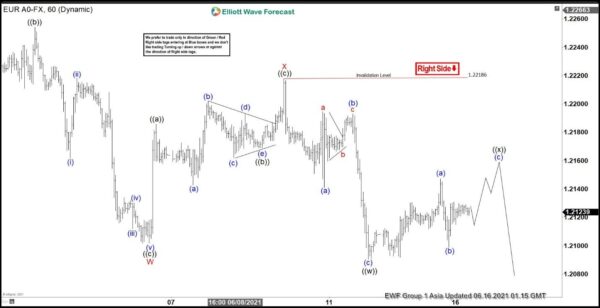
Elliott Wave View: EURUSD Looking For Support
Short Term Elliott Wave view in EURUSD suggests the decline from May 25 peak is unfolding as a double three Elliott Wave structure. Down from May 25 peak, wave W ended at 1.2102 and bounce in wave X ended at...

Fed Meeting: No Taper Talk, But Mind the Dots
All eyes will be on the Fed when it concludes its meeting at 18:00 GMT Wednesday. It is probably too early for a discussion about an exit strategy from cheap money, but the famous ‘dot plot’ of interest rate forecasts...
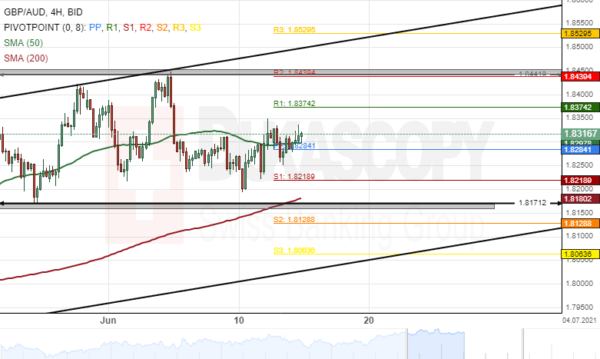
GBP/AUD 4H Chart: Tests Support Line
The British Pound has plunged by 1.30% against the Australian Dollar since the beginning of June. The currency pair tested the weekly support level at 1.8218 on June 10. All things being equal, the exchange rate could continue to edge...
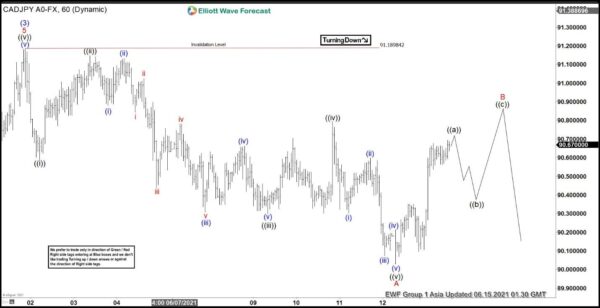
Elliott Wave View: CAD/JPY Further Correction Lower Likely
Short Term Elliott Wave in CADJPY suggests the rally to 91.19 ended wave (3). Wave (4) pullback is currently in progress with internal subdivision as a zigzag Elliott Wave structure. A zigzag structure is a 3 waves corrective structure labelled...
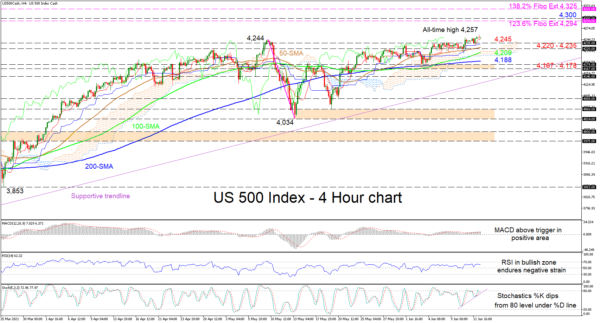
US 500 Index Bit By Bit Resumes Broader Bullish Bias
The US 500 stock index (Cash) is poised to move higher after having registered a fresh all-time high of 4,257. The 50- and 100-period simple moving averages (SMAs) are regaining their positive incline, sponsoring strengthening sentiment in the index. The...
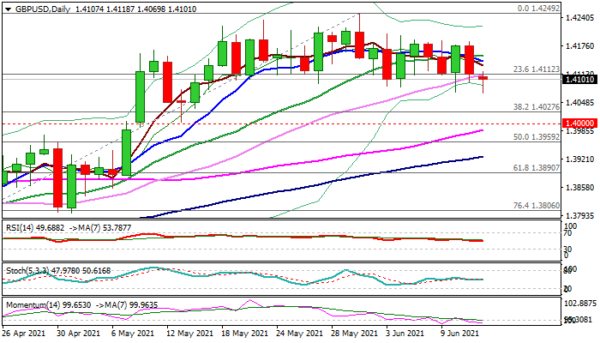
GBP/USD Outlook: Sterling Remains In Red
Cable stands at the back foot on Monday and fell to one-month low (1.4069), in extension of Friday’s 0.45% drop that generated negative signal on formation of bearish engulfing pattern on daily chart. Stronger dollar keep pound under pressure, along...
Join us on Facebook
 Signal2forex.com - Best Forex robots and signals
Do you want to have such profits and charts? Click for more info…

Recommended fast VPS provider

I have been with this company for the second month with a v.11+ VPS robot with a smaller deposit and I am satisfied. For a monthly fee of $30 from the second month, I don’t have to worry about anything and just watch the earnings. The robot earns, the Skype support is excellent and you can see that it understands trading. In the future, I will definitely increase the deposit for full use of the robot to 14 pairs. I recommend Signal2forex!!!!!

From the beginning I didn’t trust the EA robot FOREX V PORTFOLIO v.11 pro 14 because I had other trades than shown in the video on the website. After a month on two demo accounts with a deposit of 2000 USD, I must say that the EA works very well!!! Monthly appreciation of both accounts approx. 30% with max DD 19%. I have to praise the developers and keep my fingers crossed for the future.

Guys are geniuses!!! I am grateful for your work!!! Everything works, they helped me install everything and there is always feedback !!! Thanks!!!

Trading education

Introduction to Basic Trendline AnalysisIn this series we will piece together the anatomy of a swing trade and discuss ... 
Daily Forex Trading Course Walkthrough: Part TwoForex Trading Course Walkthrough Talking Points: This is the second of a ten-part series in ... 
Forex Trading Truth or Lie? Uncovering the Truths of FX TradingDo you know the truths about forex trading? Traders face a barrage of information when ... 
Daily Forex Trading Course Walkthrough: Part FiveForex Trading Course Walkthrough Talking Points: This is the fifth of a ten-part series in ... |