Talking points:
– GBPUSD has tumbled this week, with fundamental analysts pointing to Friday’s poor UK first-quarter economic growth data as an important contributor.
– However, technical analysts should have seen it coming after a key reversal week on the chart: one of the most impoortant reversal patterns.
– That shows how useful it is to look out for this important indicator of a trend change.
Check out the IG Client Sentiment data to help you trade profitably.
Why reversal patterns matter
There was a perfect example this week of why a key reversal day, or a key reversal week, can be an important pointer to a change in trend. For those new to technical analysis, this occurs when:
- In an uptrend, the price hits a new high but then closes near the previous day’s (or week’s) lows
- In a downtrend, the price hits a new low but then closes near the previous day’s (or week’s) highs
- Ideally, in an uptrend, the price should also open above the previous day’s (or week’s) close
- In a downtrend, the price should open below the previous day’s (or week’s) close
Take a look at the weekly chart below of GBPUSD. After an uptrend that began in early October 2016, there was a sharp fall in the week that began on April 16, 2018. The price hit a new high for the uptrend but ended the week lower than the week before, although the open was exactly in line with the previous week’s close.
As was to have been expected, there was then another sharp fall the following week – a development I wrote about here, when I recommended selling the pair.
GBPUSD Price Chart, Weekly Timeframe (September 2016 – April 2018)

Chart by IG
Throughout that following week, the pair continued to fall, with economists blaming the particularly sharp drop on Friday to very disappointing UK growth data for the first three months of the year. However, that should have been no surprise to chart-watchers.
GBPUSD Price Chart, Daily Timeframe (January 1 – April 27, 2018)
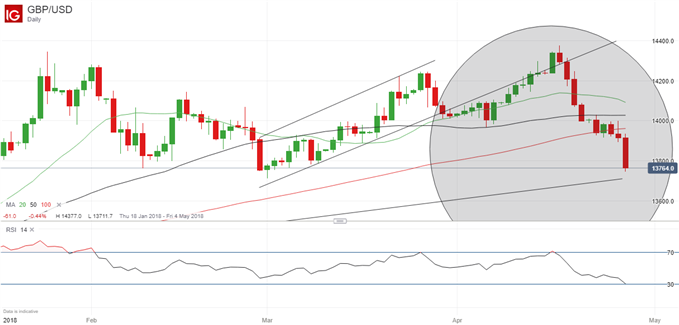
Chart by IG
Unlike some technical analysts, I do not believe that this discipline offers all the answers – it’s important to watch economic developments, geopolitics and sentiment indicators too. However, in this case, it certainly proved its worth.
Resources to help you trade the forex markets
Whether you are a new or an experienced trader, at DailyFX we have many resources to help you: analytical and educational webinars hosted several times per day, trading guides to help you improve your trading performance, and one specifically for those who are new to forex. You can learn how to trade like an expert by reading our guide to the Traits of Successful Traders.
— Written by Martin Essex, Analyst and Editor
Feel free to contact me via the comments section below, via email at martin.essex@ig.com or on Twitter @MartinSEssex
 Signal2forex.com - Best Forex robots and signals


