Chinese official PMI data for June are scheduled to be made public on Saturday at 0100 GMT. Manufacturing activity, which is expected to attract the lion’s share of attention, is projected to slightly ease though to still remain in expansionary territory. Beyond the releases, the ongoing spat between the US and China over trade and investment issues remains in the background, having the potential to move markets. Meanwhile, yuan weakness is attracting interest with some linking it to trade developments.
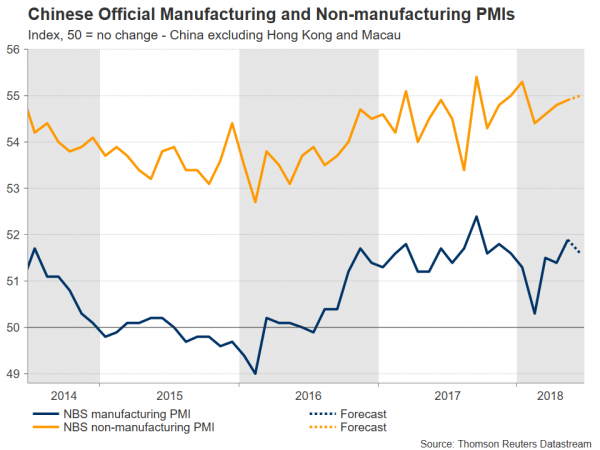
Official manufacturing PMI data out of China are anticipated to show the measure standing at 51.6 in June. This compares to May’s 51.9, which surpassed expectations to reach its highest since September 2017. Last month’s manufacturing PMI also constituted the 22nd consecutive month that the reading remained above the 50 level that distinguishes sectoral expansion from contraction. In the meantime, the respective non-manufacturing (services) PMI print is forecast to edge higher for the fourth straight month, specifically to stand at 55.0, from May’s 54.9. The Chinese services sector has gained greater prominence over the last number of years. This came on the back of government efforts to rebalance as well as diversify the economy by making it more dependent on services and spending, as opposed to relying almost entirely on investments and exports. Still, the figures on manufacturing activity are expected to be gathering more interest than those on services.
Overall, if the numbers come in line with projections, they would paint a relatively healthy picture, especially if one considers the continuing efforts by the Communist party to curb industrial pollution and limit the financial risks posed by excessive credit availability in the economy; both of these are factors that are weighing on economic activity, though at the same time they are contributing to more sustainable, higher quality growth moving forward.
Still, downside risks remain on the horizon that span beyond environmental considerations and high debt levels. Those relate to “differences” over trade – these include potential investment restrictions as well – between the US and China, the world’s two largest economies, which are seen as increasing the odds for a trade war that would act to the detriment of their respective economies as well as global growth.
USDCNH, this referring to the US dollar versus the offshore-traded yuan, hit its highest since around mid-December earlier on Wednesday, with the onshore yuan (USDCNY – depicted in the chart below) also coming under pressure against the US currency. Some are attributing the slide in the yuan as coming on the back of Chinese policymakers purposefully devaluing the currency in response to US tariff threats. The fact that not too long ago, Chinese officials were struggling to limit accelerating capital outflows due to currency weakness discredits this view though, at least to an extent. Perhaps more likely “culprits” for the fall in the renminbi are increasing doubts on whether the nation can survive a trade war with the US, softer-than-expected Chinese economic data – for example May’s fixed asset investments, industrial production and retail sales – and divergent monetary policies between the Federal Reserve and the People’s Bank of China. Furthermore, it should be kept in mind that the dollar is not just stronger versus the Chinese currency in 2018, but also against most emerging market currencies, as well as versus the majors.
Besides the yuan, the Australian dollar is also attracting interest on the back of trade jitters and has been on the decline in recent weeks, falling to multi-month low levels versus the greenback. This has to do with the fact the Australian economy heavily relies on commodity exports and is thus seen as losing out considerably in the event of the imposition of barriers to trade. Moreover, Australia shares close economic ties with China – a strong Chinese economy is seen as aussie-positive and vice versa – which have rendered the aussie as a liquid proxy for China’s economy in investors’ minds.
Technically, a rising AUDUSD could meet a barrier around the 0.7450 mark that may have held some significance in the past, managing to resist a successful close below it a few times during May; in other words, this is a point that acted as support in the past and may now provide resistance. A successful break above would turn the attention to the area around the 23.6% Fibonacci retracement level of the January 26 to June 21 downleg at 0.7529, with the current level of the 50-day moving average roughly coinciding with this level. On the downside, support might come around the near 14-month low of 0.7342 from June 21, with steeper losses potentially meeting additional support around the 0.73 round figure.
Although Saturday’s releases may spur some positioning on the aussie on Monday when markets reopen for trading – a data beat is seen as aussie-positive and vice versa – still the Australian dollar seems more sensitive at the moment to the ongoing concerns over trade. Receding fears for a trade war will likely boost the aussie, with escalating tensions having the capacity to push it further down.
Lastly, Caixin’s manufacturing and non-manufacturing PMI figures, which focus on small and medium size Chinese businesses, as opposed to the official data which are broader in nature, are due out next week (on Monday and Wednesday correspondingly).
 Signal2forex.com - Best Forex robots and signals


