
📑 Table of Contents
- 1. What Are Breakouts and Pullbacks in Trading?
- 2. Types of Breakouts
- 3. How to Identify Breakout and Pullback Setups
- 4. Breakout Entry Strategies
- 5. Comparison of Entry Methods
- 6. Types of Breakouts Comparison
- 7. Breakout vs Pullback Trading Comparison
- 8. Risk Management for Breakout and Pullback Trades
- 9. Common Mistakes to Avoid
- 10. Frequently Asked Questions
1. What Are Breakouts and Pullbacks in Trading?
Understanding breakouts and pullbacks is essential for any trader looking to capture market momentum while managing risk effectively. These two concepts form the foundation of some of the most reliable trading strategies used by professionals.
Definition of a Breakout
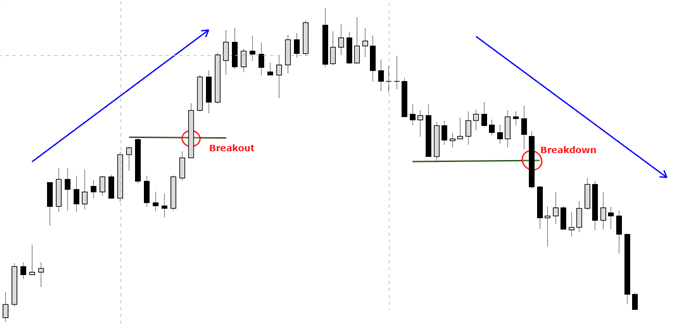
A breakout occurs when the price of an asset moves beyond a key level of support or resistance. This signals that the balance of power has shifted — buyers have overwhelmed sellers (in an upward breakout) or sellers have overwhelmed buyers (in a downward breakdown). Breakouts can be:
- Simple price level breakouts: Price breaks through a horizontal support or resistance level
- Chart pattern breakouts: Price breaks out of a recognised chart pattern such as a triangle, flag, or head-and-shoulders
- Trend breakouts: Price breaks above a swing high in an uptrend or below a swing low in a downtrend
When a breakout is genuine, it often signals the start of a new trend or the continuation of an existing one. However, not every breakout is real — false breakouts, where price briefly crosses a level before reversing, are common.
Definition of a Pullback
A pullback is a temporary counter-trend move that occurs after a breakout or during an established trend. In an uptrend, a pullback is a short-term decline; in a downtrend, it is a short-term rally.
Pullbacks are significant because they offer traders a second chance to enter a trade at a better price after a breakout. When price pulls back to a broken support or resistance level and finds support there, it confirms that the breakout was genuine — this is often called a “break and retest” pattern.
Why They Work Together
The breakout-pullback dynamic works because of market psychology. A breakout triggers fear of missing out (FOMO) among traders, while the subsequent pullback shakes out weak hands before the trend continues. This creates a self-reinforcing cycle that professional traders exploit.
2. Types of Breakouts
Breakouts come in several forms, each with its own characteristics and trading implications. Understanding the differences is key to selecting the right strategy.
Price Level Breakouts (Support/Resistance)
This is the simplest and most common type of breakout. Price breaks through a horizontal level of support or resistance that has been tested multiple times. The more times a level has been tested, the more significant the breakout. When a resistance level is broken to the upside, it often becomes new support — and vice versa.
Chart Pattern Breakouts
Many chart patterns are defined by their breakout points. Common patterns that produce breakouts include:
- Head-and-Shoulders: Breakout below the neckline signals a bearish reversal
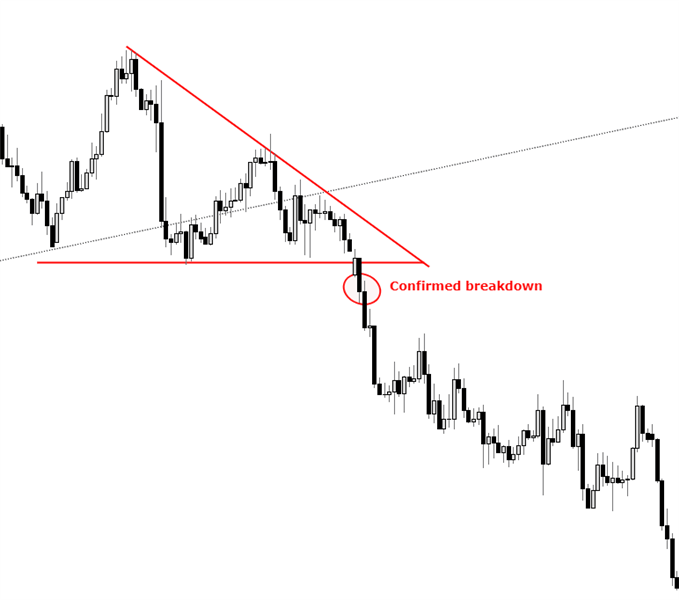
- Triangles and Wedges: Breakout from the converging trendlines signals the direction of the next move
- Rectangles: Breakout above resistance or below support signals the end of consolidation
- Bull and Bear Flags: Breakout from the flag pattern signals continuation of the prior trend
- Trendlines: Breakout above a descending trendline or below an ascending trendline signals a trend change
Trend Breakouts vs Range Breakouts
- Trend Breakout: Occurs when price breaks above the most recent swing high in an uptrend (or below the most recent swing low in a downtrend). This is often used as a continuation signal.
- Range Breakout: Occurs when price breaks out of a horizontal trading range. This signals the end of consolidation and the beginning of a new directional move.
3. How to Identify Breakout and Pullback Setups
Identifying high-quality breakout and pullback setups requires a systematic approach. Follow these steps to filter out low-probability trades.
Step 1: Identifying the Trend
Before looking for breakouts, establish the overall trend direction. Use higher timeframes (daily, weekly) to determine whether the market is in an uptrend, downtrend, or range. Breakouts in the direction of the larger trend have a higher probability of success.
Step 2: Spotting the Pullback
In a trending market, look for a pullback to a key level — such as a former resistance level that has become support (in an uptrend) or a former support level that has become resistance (in a downtrend). The pullback should show signs of slowing momentum, such as decreasing volume or the formation of reversal candlestick patterns.
Step 3: Confirming the Breakout
Once price resumes its move and breaks above the previous swing high (for a long entry) or below the previous swing low (for a short entry), look for confirmation:
- Candle close: The candle should close beyond the breakout level, not just wick through it
- Volume: A genuine breakout is typically accompanied by above-average volume
- Retest: After the breakout, price should ideally pull back to test the new level and hold
4. Breakout Entry Strategies
There are three primary methods for entering breakout trades. Each has its own risk-reward profile and suits different market conditions.
Immediate Entry (Level Crossed)
Enter the trade as soon as price crosses the breakout level. This method captures the full move but carries a higher risk of false breakouts. It works best in strongly trending markets with clear momentum.
Confirmation Entry (Candle Close)
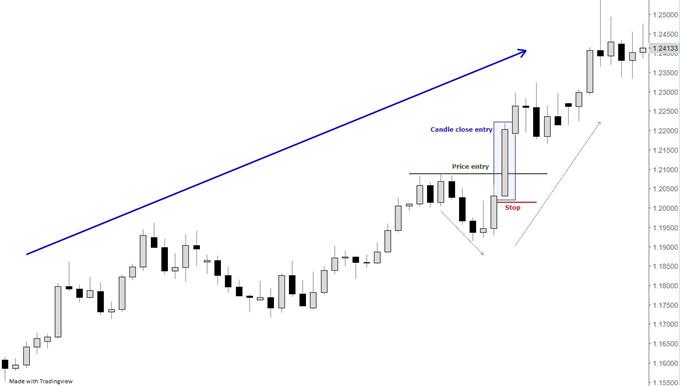
Wait for the candle to close beyond the breakout level before entering. This reduces the risk of false breakouts but means you may miss part of the initial move. It is the preferred method for traders who prioritise accuracy over speed.
Hybrid Entry (50/50 Approach)
Enter 50% of your position at the level cross and the remaining 50% on confirmation. This balances the trade-off between capturing the move and reducing false breakout risk. It requires more active management but offers the best of both worlds.
5. Comparison of Entry Methods
The table below compares the three breakout entry methods to help you choose the right approach for your trading style.
| Entry Method | Description | Advantages | Disadvantages | Best For |
|---|---|---|---|---|
| Immediate Entry | Enter as soon as level is crossed | Captures full move | Higher risk of false breakout | Strong momentum, high confidence |
| Confirmation Entry | Wait for candle close beyond level | Lower risk of false breakouts | May miss part of the move | Choppy markets, lower confidence |
| Hybrid (50/50) | 50% at cross + 50% on confirmation | Balanced approach | Requires more management | Most market conditions |
📌 The hybrid approach offers the best balance between capturing the move and reducing false breakout risk.
6. Types of Breakouts Comparison
The table below compares the different types of breakouts and their key characteristics.
| Breakout Type | Description | Key Characteristics | Best Markets |
|---|---|---|---|
| Price Level Breakout | Price breaks support/resistance | Simple, clear levels | All markets |
| Trend Breakout | Pullback within trend followed by breakout above swing high/low | Trend confirmation | Trending markets |
| Range Breakout | Price breaks out of horizontal range | Consolidation breakout | Ranging markets |
| Chart Pattern Breakout | Breakout from identified pattern | Pattern completion | All markets |
📌 Chart pattern breakouts often provide the most reliable signals due to the additional structure provided by the pattern.
7. Breakout vs Pullback Trading Comparison
The table below compares breakout trading and pullback trading to help you understand which approach suits your trading style.
| Feature | Breakout Trading | Pullback Trading |
|---|---|---|
| Entry Point | At the breakout level | After retracement to support/resistance |
| Risk Level | Higher (may be false breakout) | Lower (confirmation of support) |
| Reward Potential | Full move capture | May miss initial move |
| Best Market Condition | Strong momentum, trending | Range-bound, consolidating |
| Confirmation Needed | Volume spike, candle close | Price reaction at level |
📌 Pullback trading offers better risk-reward ratios but requires patience to wait for the retracement.
8. Risk Management for Breakout and Pullback Trades
Proper risk management is the difference between long-term success and failure in breakout and pullback trading. Here are the key principles.
Stop-Loss Placement
For long positions, place your stop-loss below the low of the confirming bullish candle (or below the pullback low). For short positions, place it above the high of the confirming bearish candle. This keeps your stop-loss out of harm’s way while still protecting against a failed breakout.
Risk-Reward Ratio
Aim for a minimum risk-reward ratio of 1:2. This means that for every dollar you risk, you aim to make at least two dollars. In strong trending markets, ratios of 1:3 or higher are achievable.
Position Sizing
Never risk more than 1–2% of your trading account on a single trade. This ensures that a series of losing trades will not significantly damage your account.
9. Common Mistakes to Avoid
Even experienced traders make mistakes when trading breakouts and pullbacks. Here are the most common pitfalls and how to avoid them.
- Entering Without Confirmation: Entering a trade as soon as price touches a level without waiting for confirmation increases the risk of false breakouts.
- Ignoring Volume: A breakout on low volume is more likely to fail. Always check volume before entering.
- Setting Stops Too Tight: Placing your stop-loss too close to the breakout level increases the risk of being stopped out by normal market noise.
- Trading Against the Trend: Breakouts that go against the larger trend are less likely to succeed. Always consider the higher timeframe context.
- Chasing the Move: Entering a trade after a large move has already occurred increases risk. Wait for a pullback or a clear entry signal.
- Failing to Adjust Stops: Once a trade moves in your favour, consider moving your stop-loss to breakeven to lock in a risk-free position.
10. Frequently Asked Questions
What is a breakout in trading?
A breakout occurs when price moves beyond a key support or resistance level, signaling a potential trend continuation or reversal. Breakouts can be simple price level breakouts or breakouts from chart patterns like triangles, flags, and head-and-shoulders.
What is a pullback in trading?
A pullback is a temporary counter-trend move that occurs after a breakout, when price retraces to test the broken level. Pullbacks provide lower-risk entry opportunities for traders who missed the initial breakout.
What is the difference between a breakout and a pullback?
A breakout is the initial move through a key level, while a pullback is the subsequent retracement back to that level. Breakouts signal momentum, while pullbacks offer confirmation and lower-risk entry points.
How do you trade breakouts and pullbacks?
To trade breakouts, enter when price crosses a key level with confirmation (volume, candle close). To trade pullbacks, wait for price to retest the broken level and show a reversal signal before entering in the direction of the breakout.
What is the best entry method for breakout trading?
The best method depends on market conditions. Immediate entry captures the full move but has higher risk. Confirmation entry (waiting for candle close) reduces false breakouts. A hybrid 50/50 approach balances both.
Where should I place my stop-loss in breakout trades?
For long positions, place the stop-loss below the low of the confirming bullish candle. For short positions, place it above the high of the confirming bearish candle.
What is a false breakout and how do I avoid it?
A false breakout occurs when price briefly breaks a level but quickly reverses back inside the range. Avoid false breakouts by waiting for candle close confirmation, checking volume spikes, and using multiple timeframe analysis.
What is the role of risk-reward ratio in breakout trading?
The risk-reward ratio should be asymmetrical in your favour — ideally at least 1:2. The distance from entry to stop-loss should be significantly smaller than the distance from entry to target.
Can breakouts and pullbacks be combined in one strategy?
Yes. The trend breakout involves a pullback followed by a breakout above the most recent swing high (for longs) or swing low (for shorts). This combines both concepts into a single setup.
What chart patterns are commonly used for breakout trading?
Common chart patterns for breakout trading include head-and-shoulders, wedges, triangles, rectangles, bull and bear flags, and trendlines.
📊 Master the Patterns Behind Breakouts: Combine your breakout and pullback strategy with reliable candlestick signals. Explore our guide to the top 10 candlestick patterns to trade the markets — featuring the most reliable reversal and continuation patterns like the hammer, engulfing patterns, and the piercing line. These patterns can help you confirm breakout entries and identify potential reversals during pullbacks.
🕯️ Spot Market Indecision with Doji Patterns: When trading breakouts and pullbacks, recognising moments of indecision can give you a significant edge. Learn how to trade the doji candlestick pattern — a powerful signal of market uncertainty that often appears before breakouts and at key pullback levels. Understanding the doji can help you anticipate breakout directions and avoid false signals.



 Signal2forex.com - Best Forex robots and signals


